GWM P Series vs iCAUR V23
A proper head-to-head in South Africa — compare price, performance, fuel economy or electric range, safety and the details that shape long-term ownership.
Includes a historical vehicle
Current, upcoming and historical vehicles can be compared side by side. Historical records keep their verified specifications, while price labels show last-listed context rather than current new-car availability.
GWM P Series
Discontinued model
Share
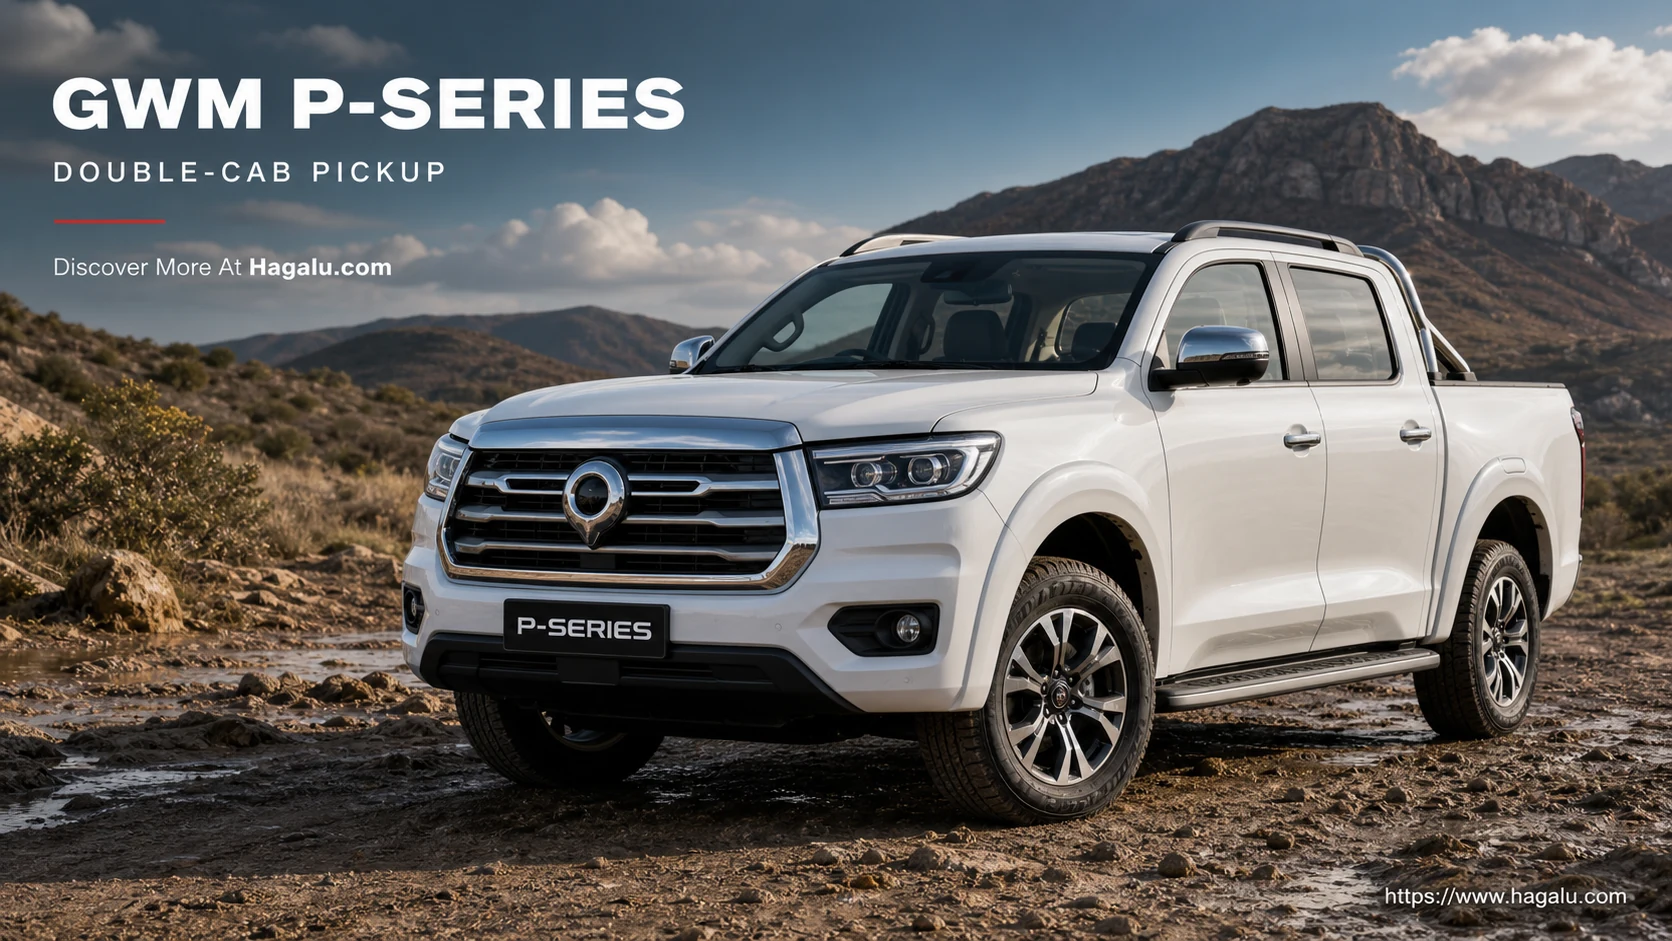
GWM P Series
2.0T Double Cab LX 4x4
Diesel
8-Speed Automatic
Discontinued model
ZAR 599,900
last listed
Discontinued model
Verified historical specifications remain visible for owner and used-car comparisons.
⚡ 110 kW
🔧 480 Nm
⛽ 9.8 km/l
VS
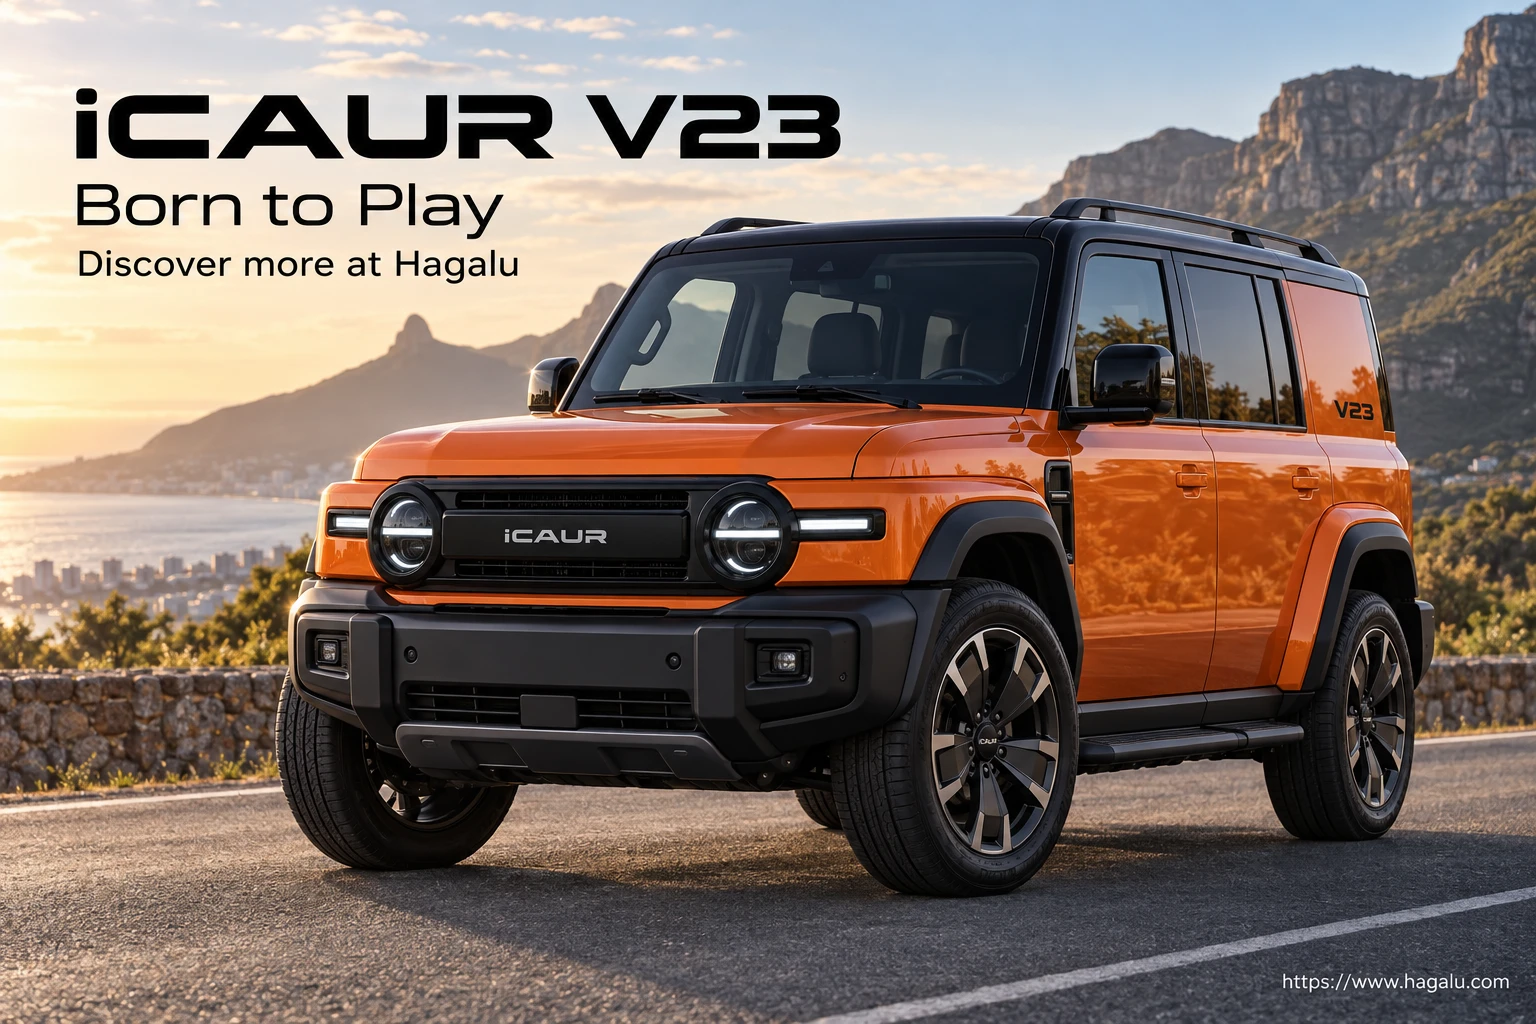
iCAUR V23
2WD
Electric
Single-Speed Reduction Gear
Current
ZAR 519,900
ex-showroom
⚡ 100 kW
🔧 180 Nm
⛽ Not applicable — electric consumption measured in kWh/100 km km/l
+
Add a 3rd car
Decision summary
GWM P Series vs iCAUR V23: the short answer
P Series and V23 are close on the comparable published fields, so buyer priorities should decide.
Recorded price context
P Series:
last listed from
ZAR 444,900
·
V23:
current from
ZAR 519,900
Five key differences
Exact selected derivativesSwipe sideways to compare every column
| Specification | P Series | V23 |
|---|---|---|
| Maximum Power | P Series110 kW | V23100 kW |
| Maximum Torque | P Series480 Nm | V23180 Nm |
| Engine Size | P Series1996 cc | V23Not Applicable |
| Combined Fuel Economy | P Series9.8 km/l | V23Not applicable — electric consumption measured in kWh/100 km km/l |
| Ground Clearance | P Series210 mm | V23190 mm |
Strongest published figure in that row; no road-test winner is implied.
Independent editorial assessment
Hagalu editorial ratings
When a variant is selected, its rating out of five applies only to that exact derivative; a model-range review is not inherited. Editorial ratings are separate from the Specification Evidence Index out of 100 and are not customer ratings.
iCAUR V23
2WD
Hagalu editorial rating
Not yet rated
No complete editorial rating is published for this exact variant. This is not a zero score.
How Hagalu rates cars →Not yet rated means a complete review is not published; it does not mean the vehicle scored zero. Read the rating methodology.
What Each Car Gets Right (and Wrong)
P Series
Strengths
- More powerful engine output
- Stronger published practicality figures
Weak Spots
- Lower fuel efficiency
- Fewer listed safety features
Best suited to:
Published Performance
Published Practicality
Specification evidence leader
V23
Strengths
- Better fuel efficiency
- Stronger listed safety equipment
Weak Spots
- Less powerful engine setup
- Lower published practicality figures
Best suited to:
Published Efficiency
Which One's Right for You?
P Series
- Buyers prioritising the stronger published powertrain figures
- Buyers prioritising the stronger published space and capacity figures
V23
- Buyers prioritising the lower published fuel or energy use
- Buyers prioritising the more complete listed safety equipment
Full Specs, Side by Side
Open a category, then swipe sideways to compare every column
Archived cars use verified historical spec records. Rows remain comparable; unavailable historical values are shown plainly rather than estimated.
| Spec | P Series | V23 |
|---|---|---|
| Model Introduced Year | 2020 | 2026 |
| Generation | The P Series sold in South Africa is the first generation marketed under the GWM banner locally, derived from Great Wall's POER platform launched in China in 2019. Local specification differs from the Chinese-market POER in suspension calibration (firmer for higher payload), 4x4 system tuning (greater bias to load-carrying durability over technical off-road performance) and trim levels (the South African range is more equipment-loaded than the domestic Chinese equivalent at the same price point). | South African May 2026 local specification sheet for the current V23 generation. |
| Facelift History | Since its 2020 South African launch, the P Series has received two notable updates. A 2022 mid-cycle refresh introduced the larger 10.25-inch infotainment screen on LS and above, updated driver-assistance calibration to reduce false lane-departure alerts on SA rural roads, and added wireless Apple CarPlay on the LT and LX. A 2024 specification update added the 360-degree camera as standard on LT trim, upgraded the rear-camera resolution across the range and revised the suspension damping after South African dealer feedback noted the original tune was firmer than ideal on Eastern Cape gravel. | - |
| Facelift Launched Since | 2024 | - |
| Facelift Version Ending | Current | - |
| Body Style | SUV | SUV |
| Body Type Cab | Double Cab | - |
| Model Year | 2026 | 2026 |
| Production Status | Active | Published |
| Segment | Pickup / LCV | Electric SUV |
| Tare Mass Kg | 1985 kg | - |
| Vehicle Type | Pickup | Passenger vehicle |
| Spec | P Series | V23 |
|---|---|---|
| Length | 5360 mm | 4220 mm |
| Width | 1900 mm | 1915 mm |
| Height | 1815 mm | 1845 mm |
| Wheelbase | 3220 mm | 2735 mm |
| Ground Clearance (Default) | 210 mm | 190 mm |
| Ground Clearance (With Full Seating Load) | 212 mm | 165 mm |
| Fuel Tank Capacity | 75 l | Not applicable — battery electric vehicle |
| Boot/Cargo Space | 0 l | 372 L rear seats up; 994 L with rear seats folded |
| Kerb Weight | 1985 kg | 1550–1850 kg |
| Gross Vehicle Weight (GVW) | 3000 kg | 2085 kg |
| Payload Capacity | 900 kg | 350–650 kg |
| Towing Capacity | 3500 kg | - |
| Seating Capacity | 5 seats | 5 seats |
| Number of Rows | 2 rows | 2 rows |
| Doors | 4 doors | 5 doors |
| Minimum Turning Radius | 13.6 m | 5.9 m |
| Front Headroom | 1020 mm | 1020 mm |
| Rear Headroom | 975 mm | 990 mm |
| Front Legroom | 1070 mm | 1060 mm |
| Rear Legroom | 880 mm | 970 mm |
| Spec | P Series | V23 |
|---|---|---|
| Front Track Width | 1560 mm | - |
| Rear Track Width | 1560 mm | - |
| Front Suspension | Double Wishbone with Torsion Bar | McPherson Strut |
| Rear Suspension | Leaf Spring | Multi-Link |
| Chassis Type | Body on Frame Ladder Chassis | - |
| Power Steering | Yes | - |
| Steering Column | Adjustable | - |
| Front Spring Type | Torsion Bar | - |
| Rear Spring Type | Leaf Spring | - |
| Front Anti-Roll Bar | Yes | - |
| Rear Anti-Roll Bar | Yes | - |
| Shock Absorber Type | Hydraulic | - |
| Chassis Material | High-strength steel | - |
| Front Suspension Type | Double Wishbone with Torsion Bar | McPherson Strut |
| Payload Front Axle | 925 kg | - |
| Rear Axle Type | Live axle | - |
| Rear Suspension Type | Leaf Spring | Multi-Link |
| Spec | P Series | V23 |
|---|---|---|
| Load Bed Length | 1520 mm | - |
| Load Bed Width | 1560 mm | - |
| Climate Control | Yes | Power air conditioner |
| Power Windows | Yes | Yes |
| Keyless Entry | Yes | Remote central locking; passive keyless access equipment-dependent |
| Push Button Start | Yes | Electronic engine start/stop or EV power-on control |
| Wireless Charging | Yes | - |
| Sunroof | No | - |
| Electric Tailgate | No | Powered tailgate optional on applicable hatch/SUV bodies |
| Automatic Headlamps | Yes | - |
| Rain Sensing Wipers | Yes | Automatic rain-sensing wipers optional or equipment-dependent |
| Auto Dimming Mirror | Yes | - |
| Boot Space Seats Folded | 0 l | - |
| Boot Space Seats Folded | 0 l | - |
| Rear Window Defroster | Yes | - |
| Electric Mirror Folding | Electric | - |
| Driver Seat Height Adjustment | Yes | - |
| Follow Me Home Headlamps | Yes | - |
| 12V Accessory Socket | Yes | - |
| Speed Limiter | Yes | - |
| AC Type | Yes | Power air conditioner |
| Adaptive Dampers | No | - |
| Aero Kit | No | - |
| Auto Dimming Irvm | Yes | - |
| Boot Opener | Yes | - |
| Chrome Exterior Highlights | Yes | - |
| Chrome Grille | Yes | - |
| Climate Zones | 2 | - |
| Door Ajar Warning | Yes | - |
| Drag Coefficient | 0.42 | - |
| Driver Display | Multi-Information Display | - |
| Electric Folding Mirrors | Yes | - |
| Engine Check Warning | Yes | - |
| Engine Start Button Illumination | Yes | - |
| Engine Start Stop | Yes | Electronic engine start/stop or EV power-on control |
| Engine Start Stop Button | Yes | Electronic engine start/stop or EV power-on control |
| Engine Warranty | 5 Years / 100,000 km | - |
| Front Armrest | Yes | - |
| Front Power Outlet | Yes | - |
| Fuel Consumption Combined | 9.8 | - |
| Fuel Lid Opener | Yes | - |
| Glovebox Cooling | No | - |
| Headlamp Height Adjust | Yes | - |
| Headlamp Washer | No | - |
| Headrest Adjustable | Yes | - |
| Heads Up Display | No | - |
| Hill Start Assist | Yes | - |
| Impact Sensing Door Unlock | Yes | - |
| Intercooler | Yes | - |
| Multi Function Steering | Yes | - |
| Panoramic Roof | No | - |
| Performance Data Logger | No | - |
| Power Mirrors | Yes | - |
| Push Button Start | Yes | Electronic engine start/stop or EV power-on control |
| Rear Defogger | Yes | - |
| Rear Reading Lamps | Yes | - |
| Rear Seat Split | No | - |
| Rear Wing | No | - |
| Remote Engine Start | No | - |
| Rev Matching | No | - |
| Ride Mode Selection | Yes | - |
| Roof Antenna | Mast Antenna | - |
| Seat Type | Bucket Seat | - |
| Seatbelt Pre Tensioner | Yes | - |
| Service Reminder | Yes | - |
| Side Steps | Yes | - |
| Skid Plates | Yes | - |
| Spare Wheel | Yes | - |
| Speed Alert System | Yes | - |
| Stabilizer Bar | Yes | - |
| Steering Mounted Controls | Yes | - |
| Steering Response | Progressive | - |
| Tachometer | Yes | - |
| Tail Lamps | Yes | - |
| Trip Computer | Yes | - |
| Tyre Repair Kit | No | - |
| Vanity Mirror | Yes | - |
| Voice Command | Yes | - |
| Voice Command Support | Yes | - |
| Active Safety Alert | Yes | - |
| Air Conditioning | Yes | Power air conditioner |
| Bed Extender | No | - |
| Bottle Holders | Yes | - |
| Bull Bar | Optional | - |
| Canopy Fitment | Compatible | - |
| Centre Console | Full-length with storage | - |
| Coat Hooks Rear | Yes | - |
| Cornering Lights | Yes | - |
| Digital Speedometer | Yes | - |
| Door Sill Trim | Aluminium | - |
| Driver Drowsiness Detection | Yes | - |
| Follow Me Home Lights | Yes | - |
| Front Wipers Type | Variable intermittent | - |
| Glove Box | Lockable illuminated | - |
| Grab Handles Rear | Yes | - |
| Headrest Front | Adjustable | - |
| Headrest Rear | Adjustable | - |
| Heated Mirrors | Yes | - |
| Horn Type | Electric | - |
| Intelligent Speed Assist | Yes | - |
| Load Bed Cover | Optional | - |
| Load Bed Light | Yes | - |
| Load Bed Steps | No | - |
| Loadbox Length Mm | 1520 mm | - |
| Loadbox Width Mm | 1560 mm | - |
| Locking Diff Rear | Yes | - |
| Low Speed Manoeuvring Assist | Yes | - |
| Oil Pressure Warning | Yes | - |
| Pedal Covers | Aluminium-style | - |
| Powered Tailgate | No | - |
| Prop Shaft | Two-piece | - |
| Puddle Lights | Yes | - |
| Reading Lights Front | Yes | - |
| Reading Lights Rear | Yes | - |
| Rear Air Conditioning | No | - |
| Rear Step Bumper | Yes | - |
| Remote Central Locking | Yes | - |
| Remote Side Mirror | Yes | - |
| Remote Start | No | - |
| Rev Counter | Yes | - |
| Rim Size | 18 | 19 in |
| Roof Load | 120 kg | - |
| Sound System | 8 | 7 |
| Stabilizer Bar Rear | Yes | - |
| Sunvisors | Dual with vanity mirrors | - |
| Surround View Monitor | No | Not fitted to 2WD local sheet |
| Tailgate Damper | Yes | - |
| Tailgate Lock | Yes | - |
| Temperature Gauge | Yes | - |
| Tie Down Hooks | Yes | - |
| Tow Bar Type | Receiver hitch compatible | - |
| TPMS | Yes | Direct tyre pressure monitoring |
| Trailer Stability Assist | Yes | - |
| Trailer Sway Control | Yes | - |
| Unlocking | Yes | Remote central locking; passive keyless access equipment-dependent |
| Vanity Mirror Illuminated | Yes | - |
| Welcome Lighting | Yes | - |
| Wireless Charger | Yes | - |
| Spec | P Series | V23 |
|---|---|---|
| Engine | 2-litre Turbocharged Diesel | Battery electric drive; no combustion engine |
| Engine Code | GW4D20 | Not Applicable |
| Fuel Type | Diesel | Electric |
| Hybrid System | Not Applicable | Not Applicable |
| Engine Displacement | 1996 cc | Not Applicable |
| Cylinders | 4 | Not Applicable |
| Cylinder Layout | Inline | Not Applicable |
| Valves | 16 | Not Applicable |
| Valves per Cylinder | 4 | Not Applicable |
| Aspiration | Turbocharged | Not Applicable |
| Fuel System | Common Rail Direct Injection | Not Applicable |
| Compression Ratio | 16.5:1 | Not Applicable |
| Bore | 84 mm | Not Applicable |
| Stroke | 90 mm | Not Applicable |
| Maximum Power | 110 kW | 100 kW |
| Maximum Torque | 480 Nm | 180 Nm |
| Combined Power | Not Applicable | Not Applicable |
| Combined Torque | Not Applicable | Not Applicable |
| Motor Type | Not Applicable | Electric traction motor |
| Number of Motors | Not Applicable | 1 |
| Motor Location | Not Applicable | Rear axle |
| Drive Type | 4WD | RWD |
| Transmission | 8-Speed Automatic | Single-Speed Reduction Gear |
| Top Speed | 175 km/h | 140 km/h |
| 0-100 km/h | 13.2 sec | 11 sec |
| Quarter Mile | Not Officially Disclosed | Not Officially Disclosed |
| Drive Modes | Not Officially Disclosed | Eco, Comfort, Sport, Individual, Slippery |
| Launch Control | No | Not Officially Disclosed |
| Rev Limiter | Not Officially Disclosed | Not Applicable |
| Power-to-Weight Ratio | 55.4 kW/tonne | Not Officially Disclosed |
| Torque-to-Weight Ratio | 241.8 Nm/tonne | Not Officially Disclosed |
| Battery Capacity | Not Applicable | 59.93 kWh |
| Usable Battery Capacity | Not Applicable | 69.0 kWh |
| Battery Type | Not Applicable | LFP |
| Battery Voltage | Not Applicable | Not Officially Disclosed |
| Electric Range | Not Applicable | 360 km |
| AC Charging Power | Not Applicable | 6.6 kW |
| DC Charging Power | Not Applicable | Not Officially Disclosed |
| AC Charging Time | Not Applicable | Not Officially Disclosed |
| DC Charging Time | Not Applicable | 36 min (20-80%) |
| Regenerative Braking | Not Applicable | Not Officially Disclosed |
| Spec | P Series | V23 |
|---|---|---|
| Engine Position | Front Longitudinal | - |
| Gearbox | 8-Speed Automatic | Single-Speed Reduction Gear |
| Drivetrain Layout | Front Engine Rear Wheel Drive | 2WD |
| LSD Available | No | - |
| Transfer Case | Yes | Not applicable to conventional BEV reduction drive |
| Differential Lock | Yes | - |
| Paddle Shifters | No | Not applicable — no conventional stepped gearbox |
| Final Drive Ratio | 3.54 | - |
| Steering Turns Lock to Lock | 16.5:1 | - |
| Number of Gears | 8 | 1 |
| Transmission Type | Automatic | Single-Speed Reduction Gear |
| Clutch Type | Torque converter | Not applicable to conventional BEV reduction drive |
| Gear Shift Indicator | Yes | Not Applicable |
| Gear Shift Type | Automatic | Electric shift gear |
| Drivetrain | 4x4 AWD | 2WD |
| 4WD Engagement | Electronic rotary dial | Not applicable to conventional BEV reduction drive |
| 4WD Hi Range | Yes | Not applicable to conventional BEV reduction drive |
| 4WD Lo Range | Yes | Not applicable to conventional BEV reduction drive |
| 4WD Selector | Electronically selectable 4WD | Not applicable to conventional BEV reduction drive |
| Automatic Shift Paddles | Yes | Not applicable — no conventional stepped gearbox |
| Differential Type Front | Open | - |
| Differential Type Rear | Open / Lockable | - |
| Front Differential Lock | Electronic locking differential | - |
| Gearbox Type | Automatic | Single-Speed Reduction Gear |
| Low Range Ratio | Yes | Not applicable to conventional BEV reduction drive |
| Low Range | Yes | Not applicable to conventional BEV reduction drive |
| Axle Layout | Front and rear driven axles | Electric drive axle(s); configuration depends on derivative |
| Rear Differential Lock | Electronic locking differential | - |
| Reverse Gear Warning | Yes | - |
| Transmission Speeds | 8 | 1 |
| Spec | P Series | V23 |
|---|---|---|
| Claimed Mileage | 9.8 km/l | Not applicable — electric consumption measured in kWh/100 km km/l |
| City Mileage | 8.3 km/l | Not applicable — electric consumption measured in kWh/100 km km/l |
| Highway Mileage | 12.2 km/l | Not applicable — electric consumption measured in kWh/100 km km/l |
| Fuel Tank Capacity | 75 l | Not applicable — battery electric vehicle |
| Emission Standard | Euro 5 | Zero tailpipe emissions (BEV) |
| AdBlue Tank Capacity | No | Not applicable — battery electric vehicle |
| Auto Start Stop | No | Not applicable — no combustion engine |
| Distance To Empty | Yes | - |
| Low Fuel Warning | Yes | - |
| Real-world Mileage | 9.8 km/l | Not applicable — electric consumption measured in kWh/100 km km/l |
| Charging Port Type | Not Applicable | - |
| Charging Type | Not Applicable | AC and DC charging; V2L external discharge 3.3 kW |
| Fuel Filler Cap | Lockable | - |
| Fuel Tank Litres | 75 | Not applicable — battery electric vehicle |
| Combined Driving Range | Not Applicable | 360 km |
| Electric Consumption | Not Applicable | 20 kWh/100 km |
| Range Real World Highway | Not Applicable | 341 km |
| Range Real World Mixed | Not Applicable | 401 km |
| Spec | P Series | V23 |
|---|---|---|
| Airbags | 6 | Dual front, front side and side curtain airbags |
| ABS | Yes | Yes |
| Electronic Stability Control | Yes | Yes |
| Traction Control | Yes | Yes |
| Hill Descent Control | Yes | Yes |
| Hill Start Assist | Yes | Yes |
| Child Safety Lock | Yes | - |
| ISOFIX Mounts | Yes | Yes |
| Brake Assist | Yes | Yes |
| Tyre Pressure Monitor | Yes | Direct tyre pressure monitoring |
| Engine Immobiliser | Yes | Body anti-theft alarm and anti-theft horn |
| Alarm System | Yes | - |
| Central Locking | Yes | - |
| Side Impact Beams | Yes | - |
| Seatbelt Warning All Seats | Yes | Driver and front passenger seatbelt reminders |
| Speed Alert System | Yes | - |
| Pedestrian Detection AEB | Yes | - |
| Front Parking Sensors | No | - |
| Safety Rating | 5 | - |
| Whiplash Protection | Yes | - |
| Lane Change Warning | Yes | - |
| AEB | Yes | Not fitted to 2WD local sheet |
| BA | Yes | Yes |
| Brake Override System | Yes | Yes |
| Curtain Airbags | Yes | Yes |
| Driver Airbag | Yes | Yes |
| EBD | Yes | Yes |
| Engine Immobiliser | Yes | - |
| Fatigue Detection | Yes | - |
| Hill Hold | Yes | Yes |
| Passenger Airbag | Yes | Yes |
| Rear Cross Traffic Alert | Yes | - |
| Seatbelt Pretensioners | Yes | Front pretensioner seat belts |
| Seatbelt Reminder | Yes | Yes |
| Side Airbags | Yes | Yes |
| Stability Control | Yes | Yes |
| TCS | Yes | Yes |
| Blind Spot Monitoring | Yes | - |
| Knee Airbag | No | - |
| ABS EBD | Yes | Yes |
| Tracking System | Optional | - |
| Spec | P Series | V23 |
|---|---|---|
| Cruise Control | Yes | Cruise control |
| Adaptive Cruise Control | No | Not fitted to 2WD local sheet |
| Lane Keep Assist | Yes | Not fitted to 2WD local sheet |
| Lane Departure Warning | Yes | Not fitted to 2WD local sheet |
| Blind Spot Monitoring | Yes | Not fitted to 2WD local sheet |
| Rear Cross Traffic Alert | Yes | - |
| Parking Sensors | Front and Rear | - |
| Rear View Camera | Yes | Reverse camera |
| 360 Degree Camera | No | Not fitted to 2WD local sheet |
| Autonomous Emergency Braking | Yes | Not fitted to 2WD local sheet |
| Driver Fatigue Alert | Yes | - |
| Traffic Sign Recognition | No | - |
| Auto Highbeam | Yes | Automatic highbeam control |
| Auto Lights | Yes | - |
| Auto Wipers | Yes | Auto speed-sensing front wiper |
| Eco Mode | No | - |
| EV Mode | No | - |
| Rear Parking Sensors | Yes | - |
| Reverse Camera | Yes | Reverse camera |
| Sport Mode | No | - |
| Adaptive Cruise Control | No | Not fitted to 2WD local sheet |
| Park Assist | Yes | - |
| Around View Monitor | No | Not fitted to 2WD local sheet |
| Attention Assist | Yes | - |
| Auto Park Assist | No | - |
| Blind Spot Warning | Yes | Not fitted to 2WD local sheet |
| Forward Collision Warning | Yes | Not fitted to 2WD local sheet |
| Rain Sensor Wipers | Yes | - |
| Reverse Camera Type | Wide-angle | - |
| Reversing Camera | Yes | - |
| Spec | P Series | V23 |
|---|---|---|
| Seat Material | Leather | Leather seats |
| Seat Adjustment | Yes | - |
| Heated Seats | Yes | Not fitted to 2WD local sheet |
| Ventilated Seats | No | Yes |
| Steering Type | Yes | - |
| Steering Adjustment | Tilt and Telescopic | - |
| Ambient Lighting | Yes | Interior reading and ambient equipment as listed on sheet |
| Folding Rear Seats | No | - |
| Front Armrest | Yes | - |
| Rear Armrest | Yes | - |
| Front Shoulder Room | 1440 mm | - |
| Rear Shoulder Room | 1420 mm | - |
| Cup Holders | Yes | - |
| Rear USB Ports | Yes | - |
| Steering Wheel Material | Leather Wrapped | Leather steering wheel |
| Instrument Cluster Type | Digital Instrument Cluster | - |
| Interior Colour Options | 1 | - |
| Driver Lumbar Support | Yes | - |
| Door Map Pockets | Yes | - |
| 60 40 Split Seat | No | Foldable second-row seats |
| Adjustable Driver Seat | Yes | - |
| Adjustable Front Seat | Yes | - |
| Cooled Seats | No | - |
| Driver Seat Adjustment | 8-Way Electric | 6-way power adjustment |
| Fabric Seats | No | - |
| Front Headrest | Yes | - |
| Leather Seats | Yes | - |
| Memory Seats | No | - |
| Passenger Seat Adjustment | 4-Way Manual | 4-way power adjustment |
| Rear Headrest | Yes | - |
| Armrest Front | Folding with storage | - |
| Armrest Rear | Centre folding with cupholders | - |
| Cargo Net | No | - |
| Interior Courtesy Lights | LED | - |
| Interior Trim Colour | Black with silver accents | - |
| Rear Seat Ventilation | No | - |
| Seat Adjustment Driver Backrest | Yes | - |
| Seat Adjustment Driver Fore Aft | Yes | - |
| Seat Adjustment Driver Height | Yes | - |
| Seat Belt Warning | Yes | - |
| Seat Trim | Synthetic leather upholstery | Leather |
| Third Row Seating Capacity | 0 | - |
| Third Row Seats | No | - |
| Spec | P Series | V23 |
|---|---|---|
| Infotainment System | Yes | 15.4 in touchscreen infotainment |
| Apple CarPlay | Yes | Wireless Apple CarPlay |
| Android Auto | Yes | Wireless Android Auto |
| Bluetooth Connectivity | Yes | Yes |
| Number of Speakers | 8 | 7 |
| Navigation System | Yes | - |
| Digital Instrument Cluster | Yes | - |
| USB Ports | 2 | 2 USB Type-C front-row ports; 1 front-row USB on 2WD |
| Wireless Apple CarPlay | Yes | Wireless Apple CarPlay |
| Wireless Android Auto | Yes | Wireless Android Auto |
| FM Radio | Yes | - |
| Steering Wheel Audio Controls | Yes | - |
| Voice Recognition | Yes | - |
| AUX Input | Yes | - |
| Infotainment Screen Size | Yes | 15.4 in |
| Wi-Fi Hotspot | No | - |
| Audio Controls On Steering | Yes | - |
| Infotainment Display | 12.3-inch Touchscreen | - |
| Rear Usb | Yes | - |
| Premium Audio | Yes | - |
| Audio Speakers | 8 | 7 |
| Head Up Display | No | - |
| Infotainment Screen | Yes | 15.4 in |
| Radio | Yes | - |
| Touchscreen | Yes | 15.4 in |
| Spec | P Series | V23 |
|---|---|---|
| LED Headlamps | Yes | Yes |
| Daytime Running Lamps | Yes | LED daytime running lights |
| Fog Lamps | Yes | - |
| Roof Rails | Yes | Body style and optional package dependent; not confirmed for this exact derivative |
| Alloy Wheel Design | Multi-Spoke Alloy | - |
| Chrome Exterior Finish | Yes | - |
| Body Cladding | Yes | - |
| Rear Spoiler | No | - |
| Exterior Colour Options | 5 | Warm Orange; Starlight Silver; Cyan Grey; Carbon Crystal Black; Texture Green; Khaki; White |
| Roof Type | Metal Roof | - |
| Wing Mirror Type | Electric Adjustable | - |
| Rear Wiper | No | - |
| Door Handle Finish | Body Coloured | - |
| Body Type | Pickup | - |
| DRL | Yes | LED daytime running lights |
| Fog Lights | Yes | - |
| Front Fog Lights | Yes | - |
| Led Headlights | Yes | Yes |
| Led Taillights | Yes | - |
| Rear Fog Lights | Yes | - |
| Front Overhang | 980 mm | - |
| Rear Overhang | 1160 mm | - |
| Auto Headlights | Yes | - |
| Daytime Running Lights | Yes | LED daytime running lights |
| Exterior Colour Options | 6 | - |
| Exterior Mirror Electric | Yes | - |
| Front Fog Lamps | Yes | - |
| Headlamps | Yes | Yes |
| Headlight Type | Yes | Yes |
| Headlights | Yes | Yes |
| Load Bed Liner | Optional | - |
| Panoramic Sunroof | No | Optional or derivative-dependent; no exact South African trim fitment established |
| Spec | P Series | V23 |
|---|---|---|
| Approach Angle | 30 deg | - |
| Departure Angle | 26 deg | - |
| Wading Depth | 800 mm | - |
| Terrain Modes | Yes | Eco, Comfort, Sport, Individual, Slippery |
| Locking Differential | Yes | - |
| Underbody Protection | Yes | - |
| Ramp Breakover Angle | 22 deg | - |
| Recovery Hooks | Yes | - |
| 4WD System Type | Part-Time 4WD with Low Range | Not applicable to conventional BEV reduction drive |
| Hill Descent Control | Yes | Yes |
| Ramp-over Angle | 24 deg | - |
| Breakover Angle | 24 deg | - |
| Ground Clearance Max | 210 mm | - |
| Ground Clearance Min | 210 mm | - |
| Off Road Descent Control | Yes | - |
| Off Road Traction Assist | Yes | - |
| Terrain Response System | No | - |
| Underbody Camera | Yes | - |
| Spec | P Series | V23 |
|---|---|---|
| Tyre Size | 265/60R18 | 255/55 R19 |
| Wheel Type | Multi-Spoke Alloy | - |
| Front Brake Type | Ventilated Disc | Ventilated Disc |
| Rear Brake Type | Drum | Disc |
| Spare Wheel Type | Yes | - |
| Front Brake Disc Diameter | 320 mm | - |
| Rear Brake Drum Diameter | 300 mm | - |
| Parking Brake Type | Electronic | - |
| Tyre Load Index | 112 | - |
| Tyre Speed Rating | S | - |
| Wheel Rim Size | 18 | 19 in |
| Brake Type Front | Ventilated Disc | - |
| Brake Type Rear | Drum | - |
| Spare Tyre | Yes | - |
| Tyre Type | All-Terrain Radial | - |
| Front Tyre Width | 265 mm | - |
| Rear Tyre Width | 265 mm | - |
| Wheel Diameter | 18 | 19 in |
| All Terrain Tyres | No | - |
| Auto Brake Hold | Yes | - |
| Cornering Brake Control | Yes | - |
| Electronic Brakeforce Distribution | Yes | - |
| Fifth Wheel Prep | No | - |
| Handbrake Type | Electronic parking brake | - |
| Hydraulic Brake Assist | Yes | - |
| Mud Terrain Tyres | No | - |
| Run Flat Tyres | No | - |
| Spare Wheel Location | Under vehicle / boot floor | - |
| Steering Wheel Audio Controls | Yes | - |
| Steering Wheel Cruise Controls | Yes | - |
| Steering Wheel Phone Controls | Yes | - |
| Tyre Pressure Display | Yes | - |
| Wheel Cover | Alloy | - |
| Wheel Locking Nuts | Yes | - |
| Wheel Material | Multi-Spoke Alloy | - |
| Wheels | Multi-Spoke Alloy | - |
| Winter Tyres | No | - |
| Spec | P Series | V23 |
|---|---|---|
| Service Interval | 10000 | - |
| Approx Service Cost | Included in Service Plan | - |
| Maintenance Plan | 5 Years / 75,000 km | - |
| Engine Oil Capacity | 8.0 l | - |
| Engine Oil Change Interval | 10,000 km | - |
| First Service At | 5000 | - |
| Service Plan Duration | 5 Years / 75,000 km | 5 years/100,000 km service plan in the official South African press material; confirm final booklet. |
| Service Plan Distance | 5 Years / 75,000 km | 5 years/100,000 km service plan in the official South African press material; confirm final booklet. |
| Anti-Rust Treatment | Yes | - |
| Alternator | 120A | - |
| Service Plan | 5 Years / 75,000 km | 5 years/100,000 km service plan in the official South African press material; confirm final booklet. |
| Service Intervals | 10000 | - |
| Spec | P Series | V23 |
|---|---|---|
| Warranty Years | 5 Years / 100,000 km | Vehicle warranty 8 years/200,000 km; high-voltage battery warranty 8 years/160,000 km in official South African press material. |
| Warranty Kilometers | 5 Years / 100,000 km | Vehicle warranty 8 years/200,000 km; high-voltage battery warranty 8 years/160,000 km in official South African press material. |
| Roadside Assistance | Yes | - |
| Anti-Corrosion Warranty | 6 Years | - |
| Basic Warranty | 5 Years / 100,000 km | Vehicle warranty 8 years/200,000 km; high-voltage battery warranty 8 years/160,000 km in official South African press material. |
| Roadside Assistance | Yes | - |
| Warranty | 5 Years / 100,000 km | Vehicle warranty 8 years/200,000 km; high-voltage battery warranty 8 years/160,000 km in official South African press material. |
| Spec | P Series | V23 |
|---|---|---|
| CO2 Emissions | 258 g/km | Not applicable — battery electric vehicle |
| Start Stop System | No | - |
| Noise Level | Moderate | - |
| Variable Valve Timing | No | - |
| Fuel Octane Requirement | Diesel | - |
| Particulate Filter | Yes | - |
| Euro Emission Standard | Euro 5 | - |
| Green NCAP Rating | 3/5 | - |
| Idle CO2 Output | 258 | - |
| Fuel Evaporation Control | EVAP Canister | - |
| Spec | P Series | V23 |
|---|---|---|
| Real-world City Mileage Min | 10.5 l/100km | - |
| Real-world City Mileage Max | 13.0 l/100km | - |
| Real-world Highway Mileage Min | 8.5 l/100km | - |
| Real-world Highway Mileage Max | 11.0 l/100km | - |
| Spec | P Series | V23 |
|---|---|---|
| Ownership Role | GWM South Africa ownership programme | Current local retail price; confirm quotation inclusions, warranty and service plan with iCAUR South Africa. |
| Price Zar | 537950 ZAR | 519900 ZAR |
| Pricing Role | Current model/derivative retail or starting-price reference | Current South African retail price |
| Starting Price | 537950 | 519900 |
| Starting Price Zar | 537950 | 519900 |
In depth: how these cars differ
This P Series and V23 comparison uses the exact derivatives selected above for South Africa. The catalogue index covers performance, efficiency, safety equipment, practicality and ownership cover only where comparable source-backed fields are present.
Performance index: P Series 61 vs V23 42.
Efficiency index: P Series 41 vs V23 99.
Safety-equipment index: P Series 91 vs V23 93.
Practicality index: P Series 81 vs V23 60.
Ownership-cover index: P Series 65 vs V23 not separately scored.
These figures are Hagalu catalogue-comparison indicators, not customer ratings, crash-test scores, resale guarantees or a substitute for a road test. Each page shows its weighted source coverage beside the result.
Model imagery
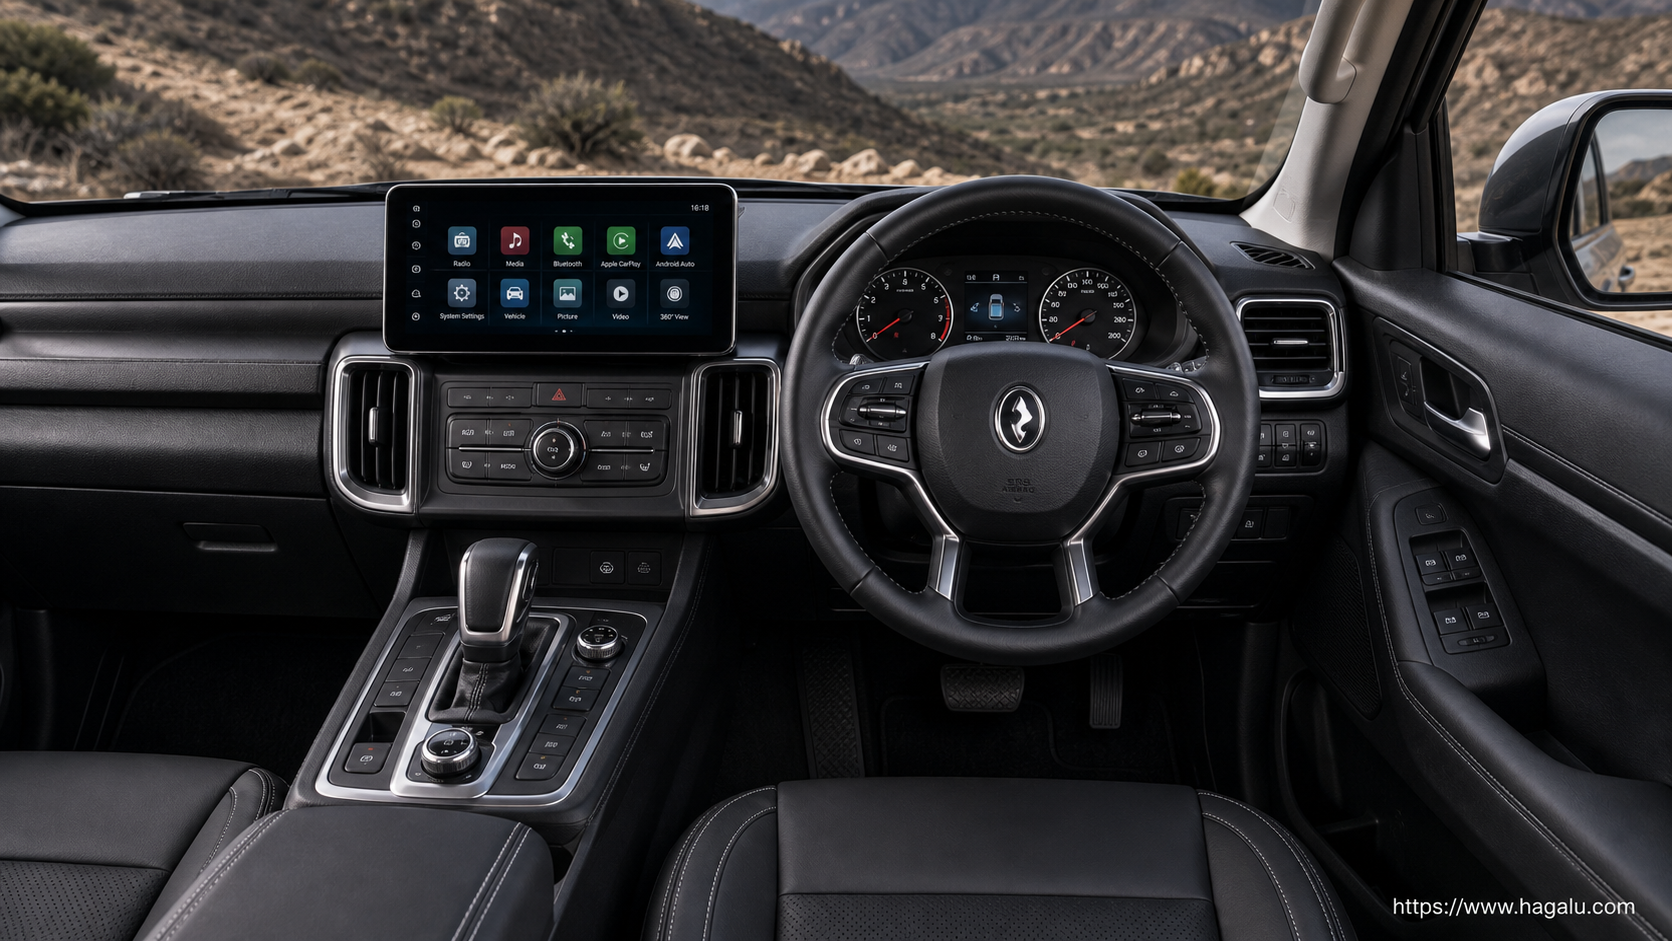
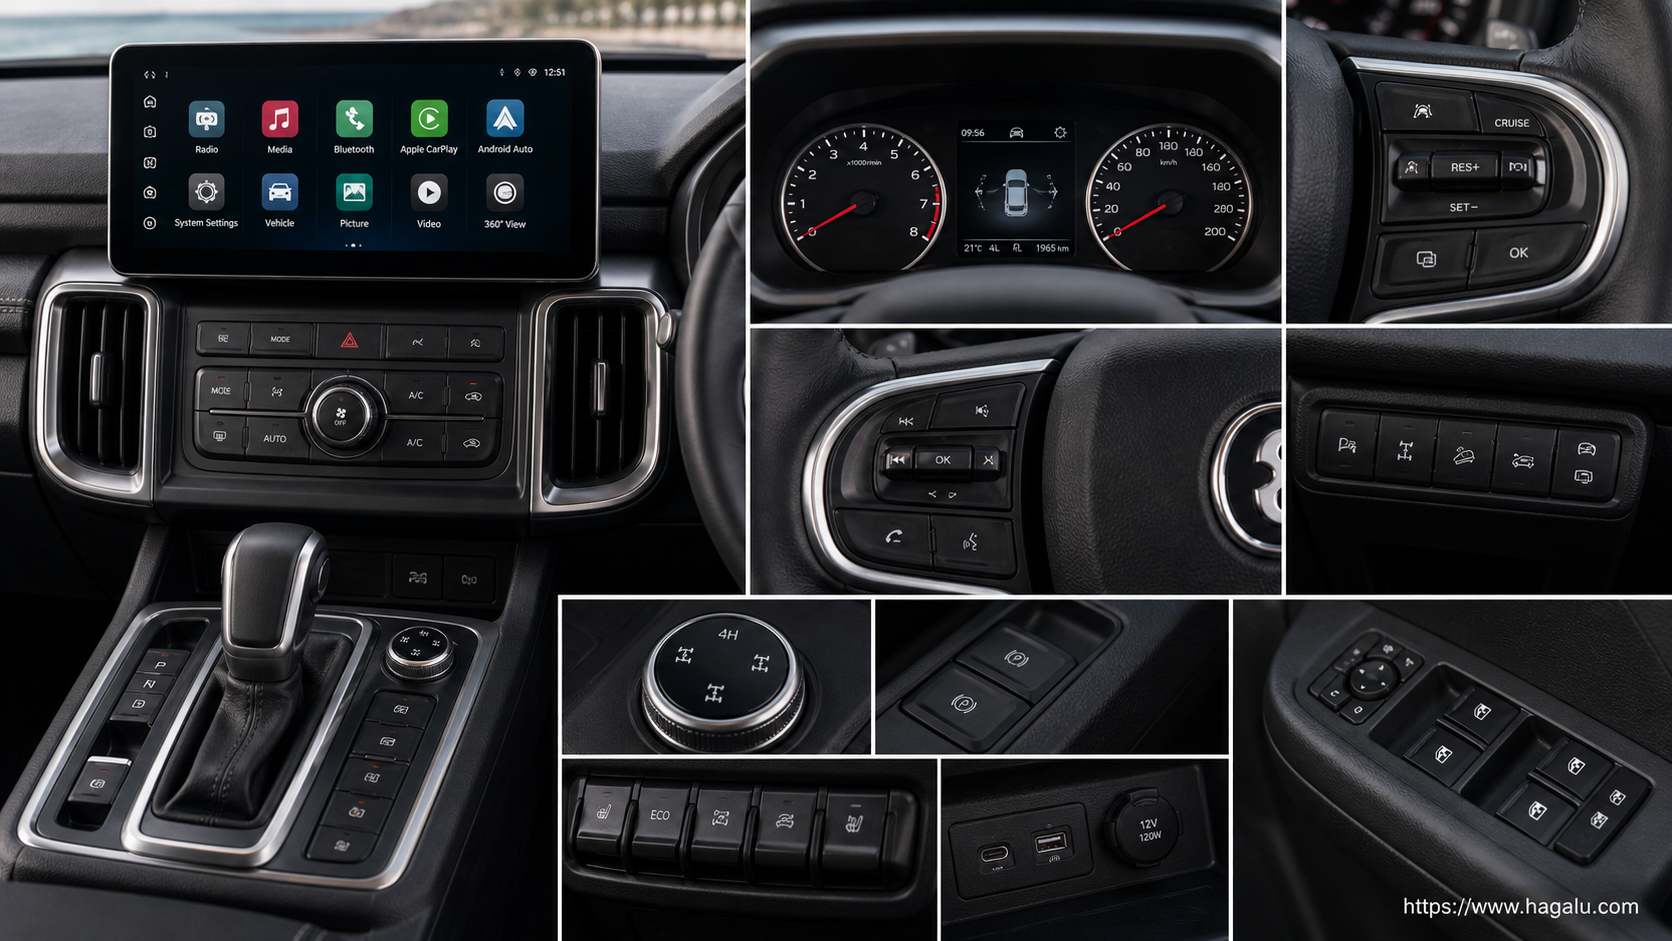
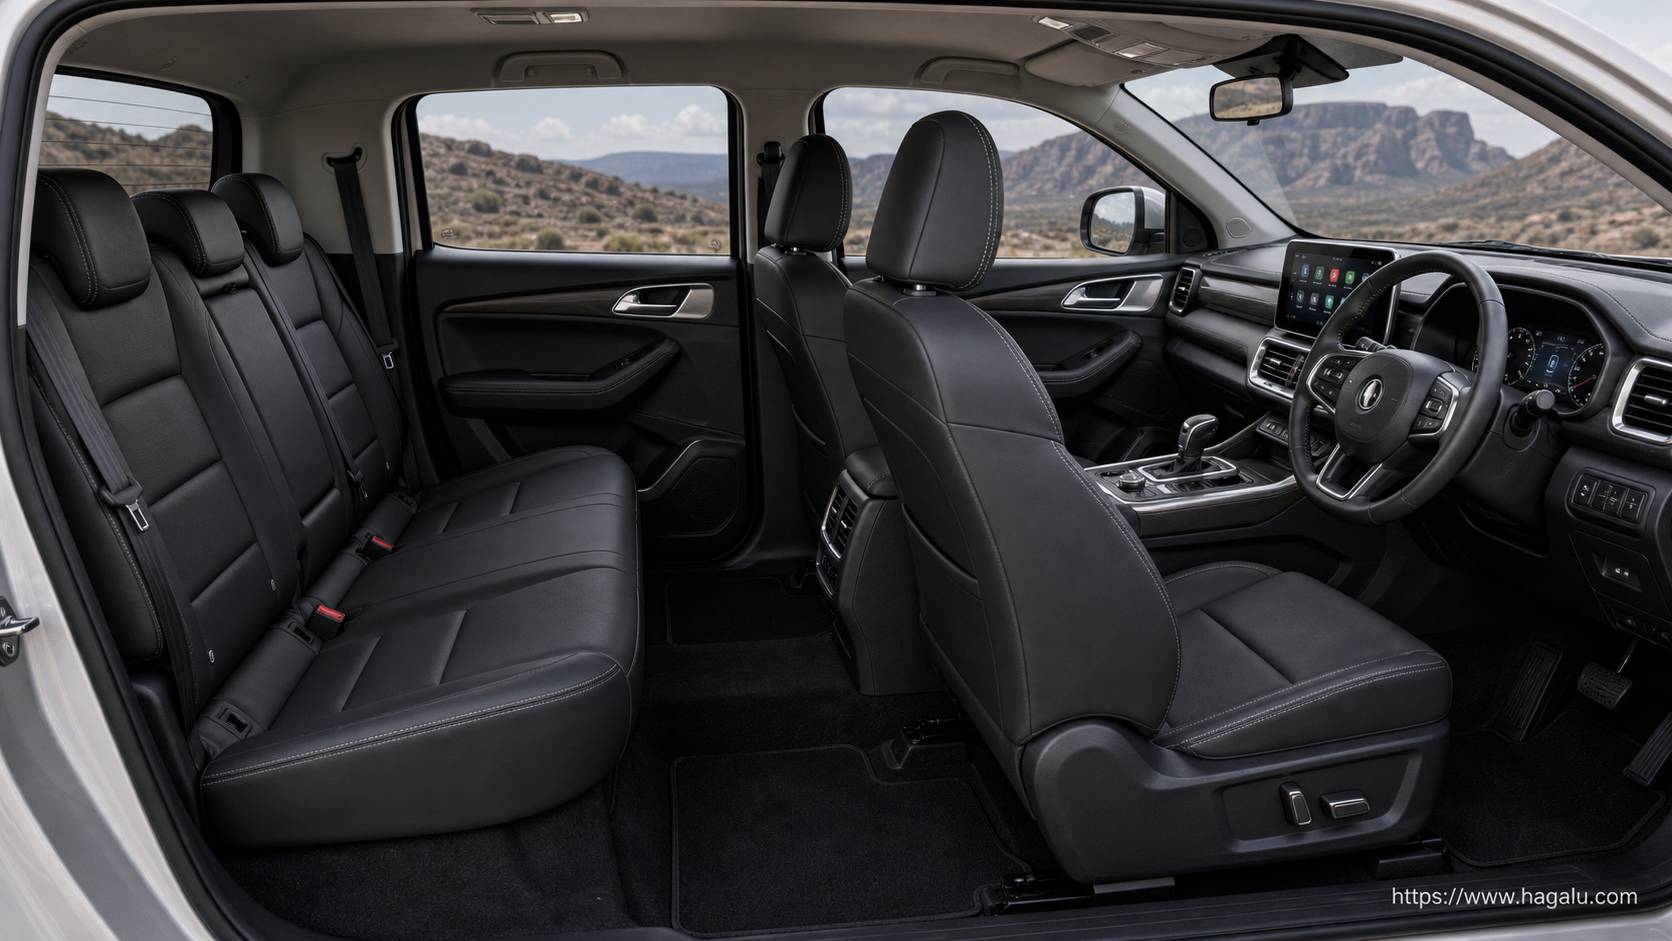
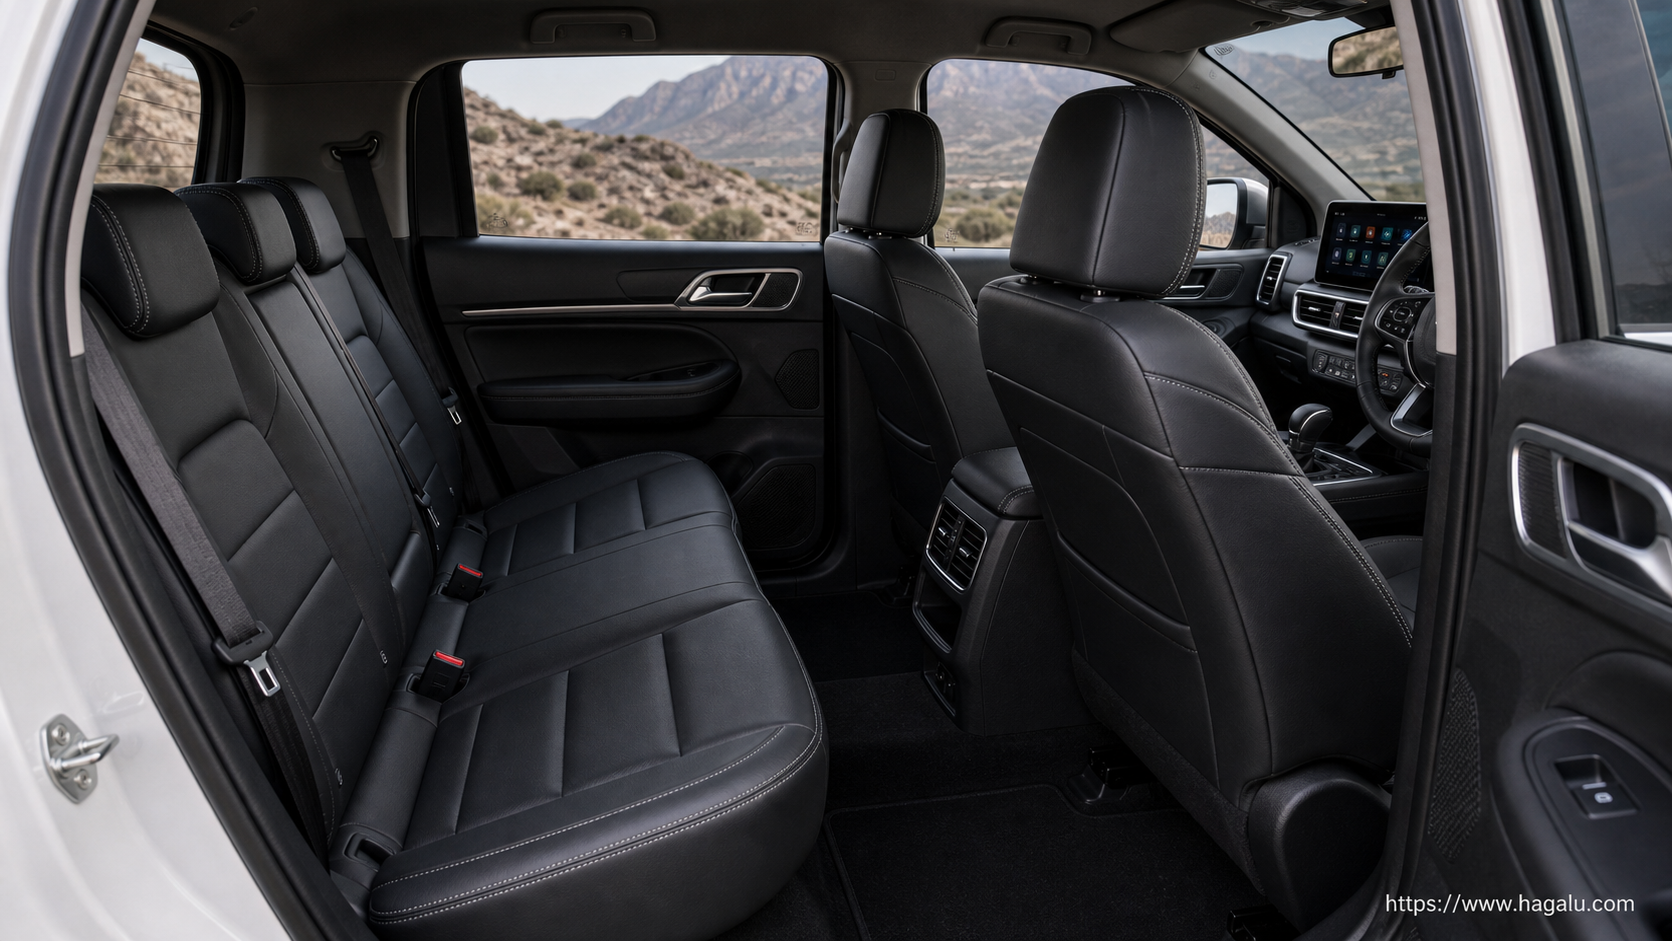
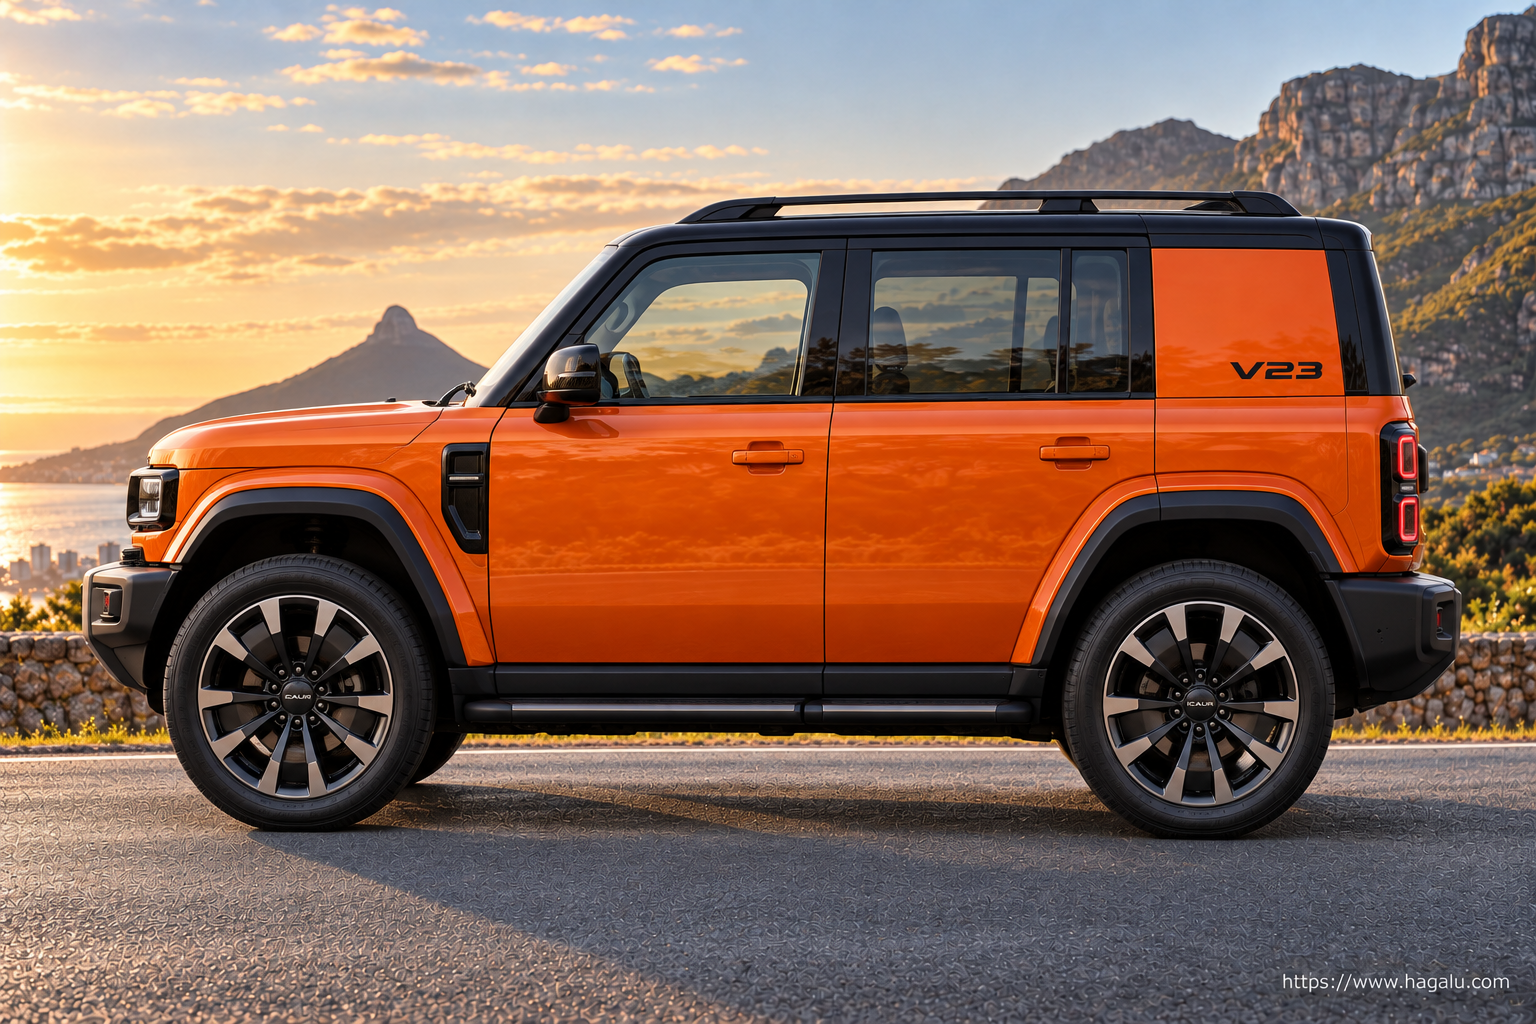
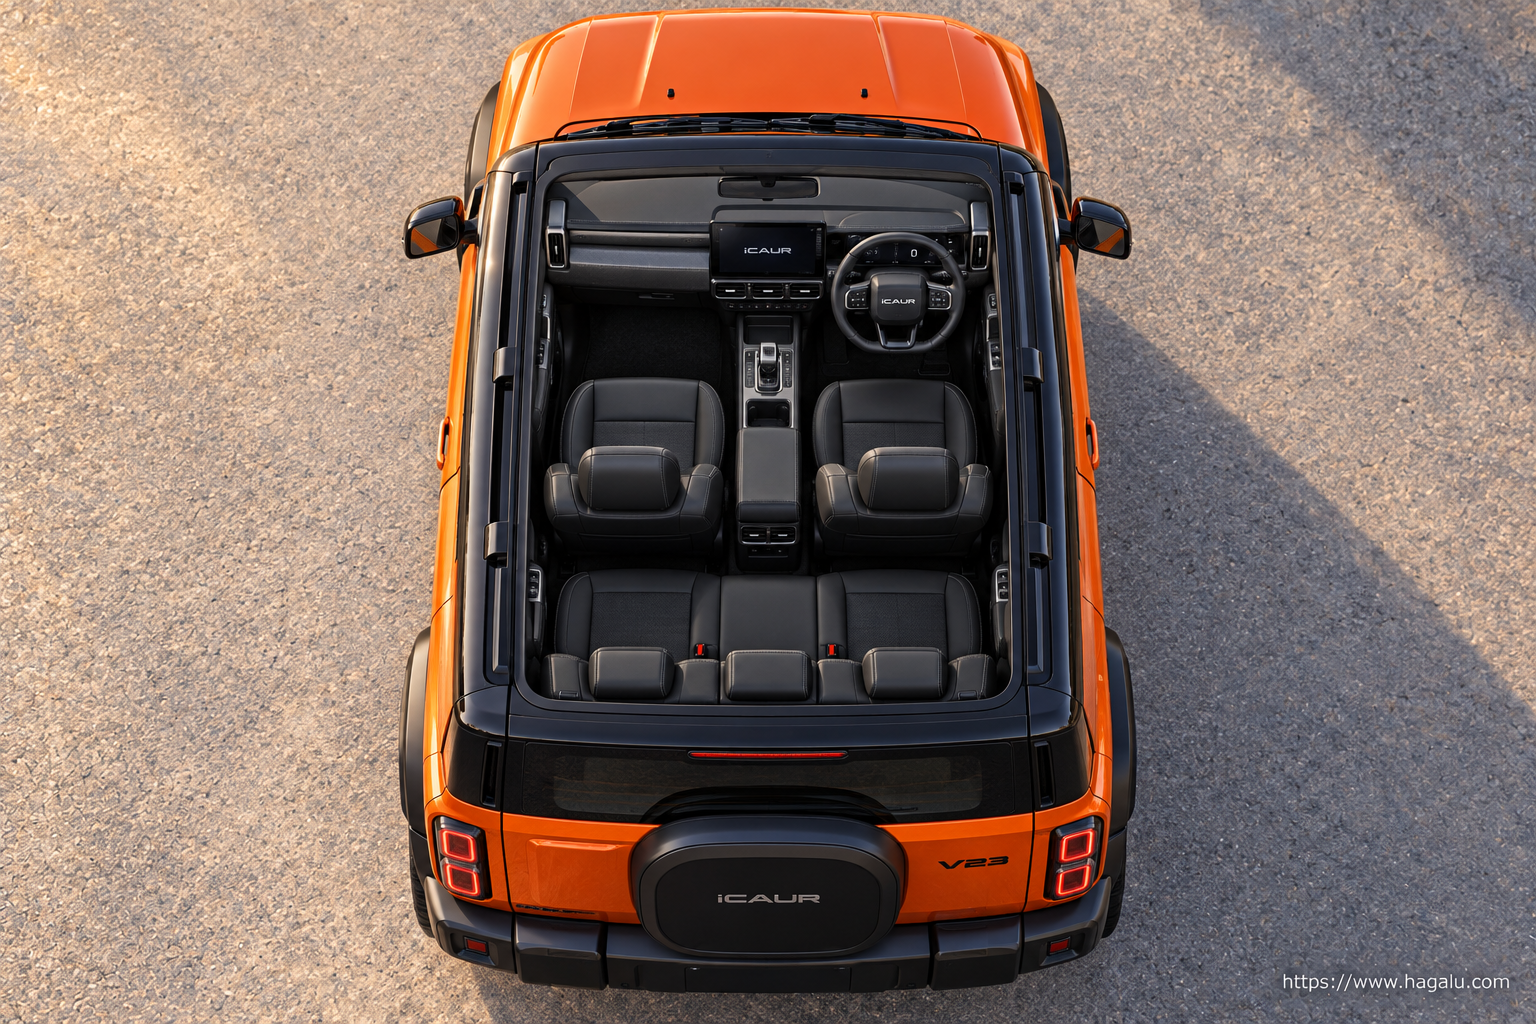
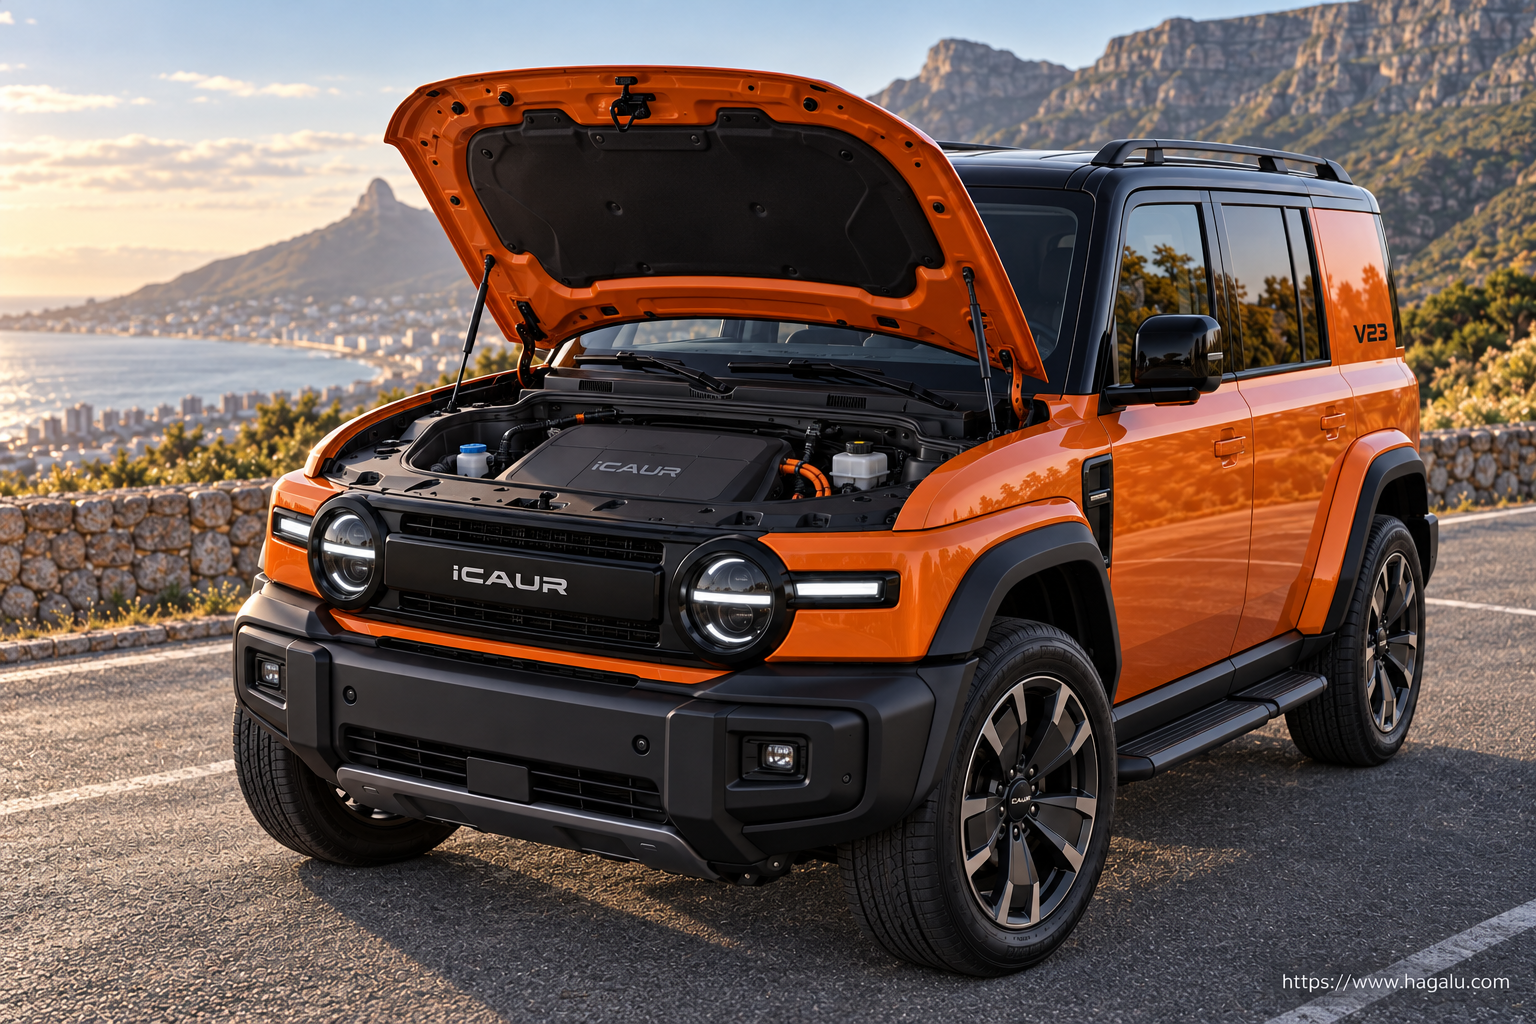
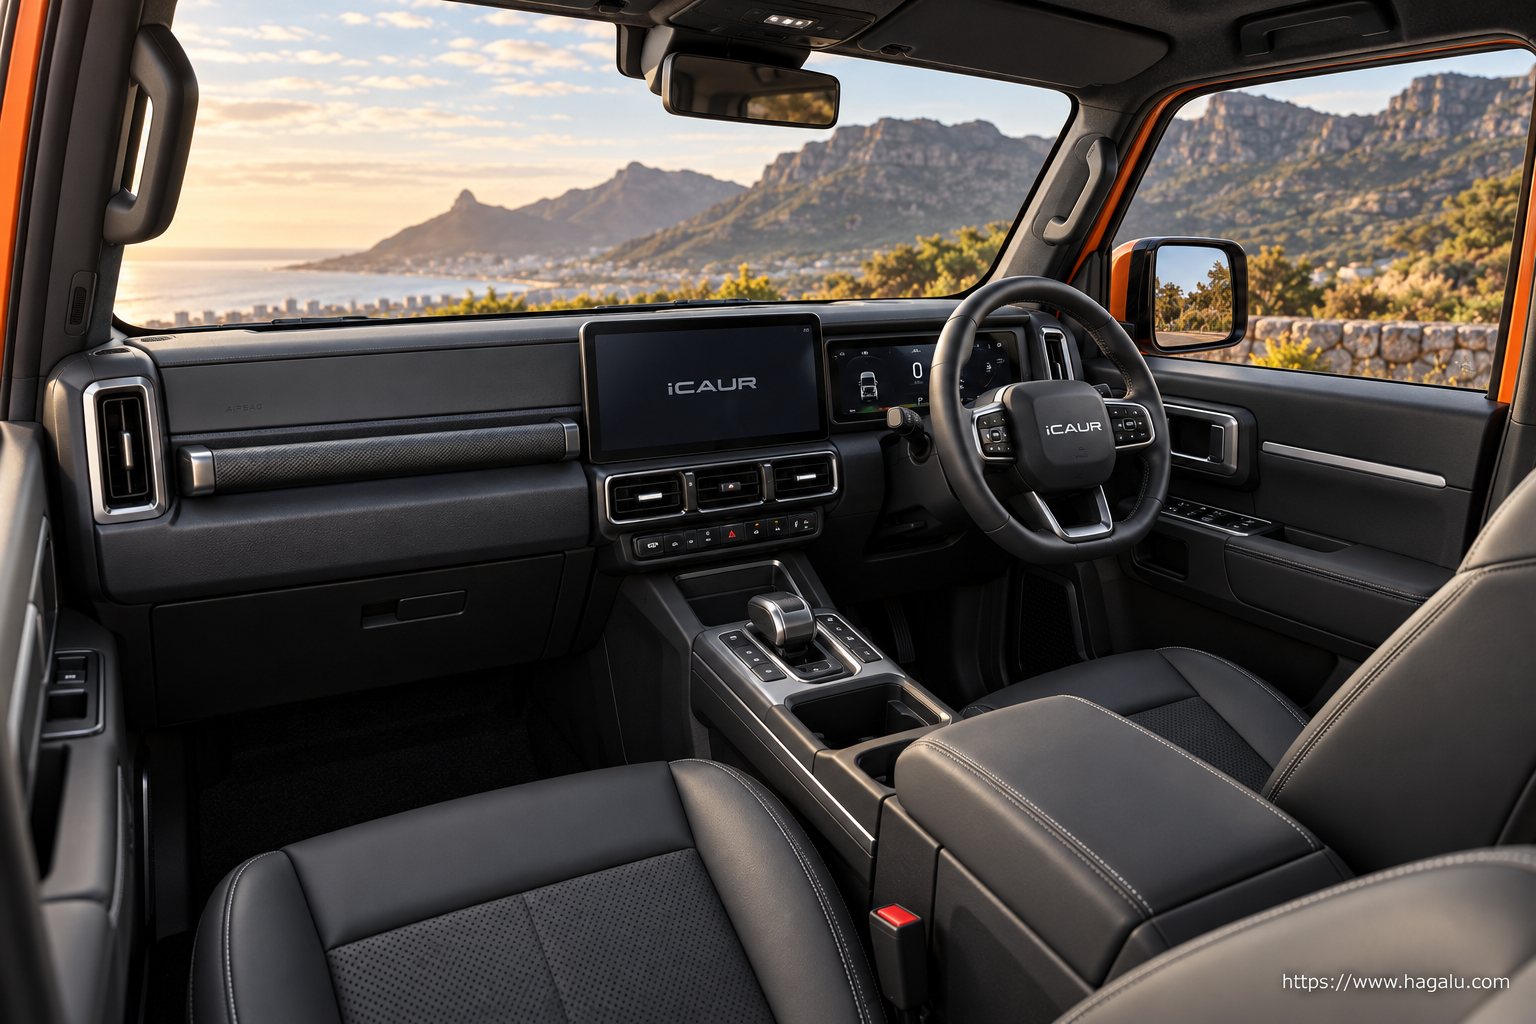
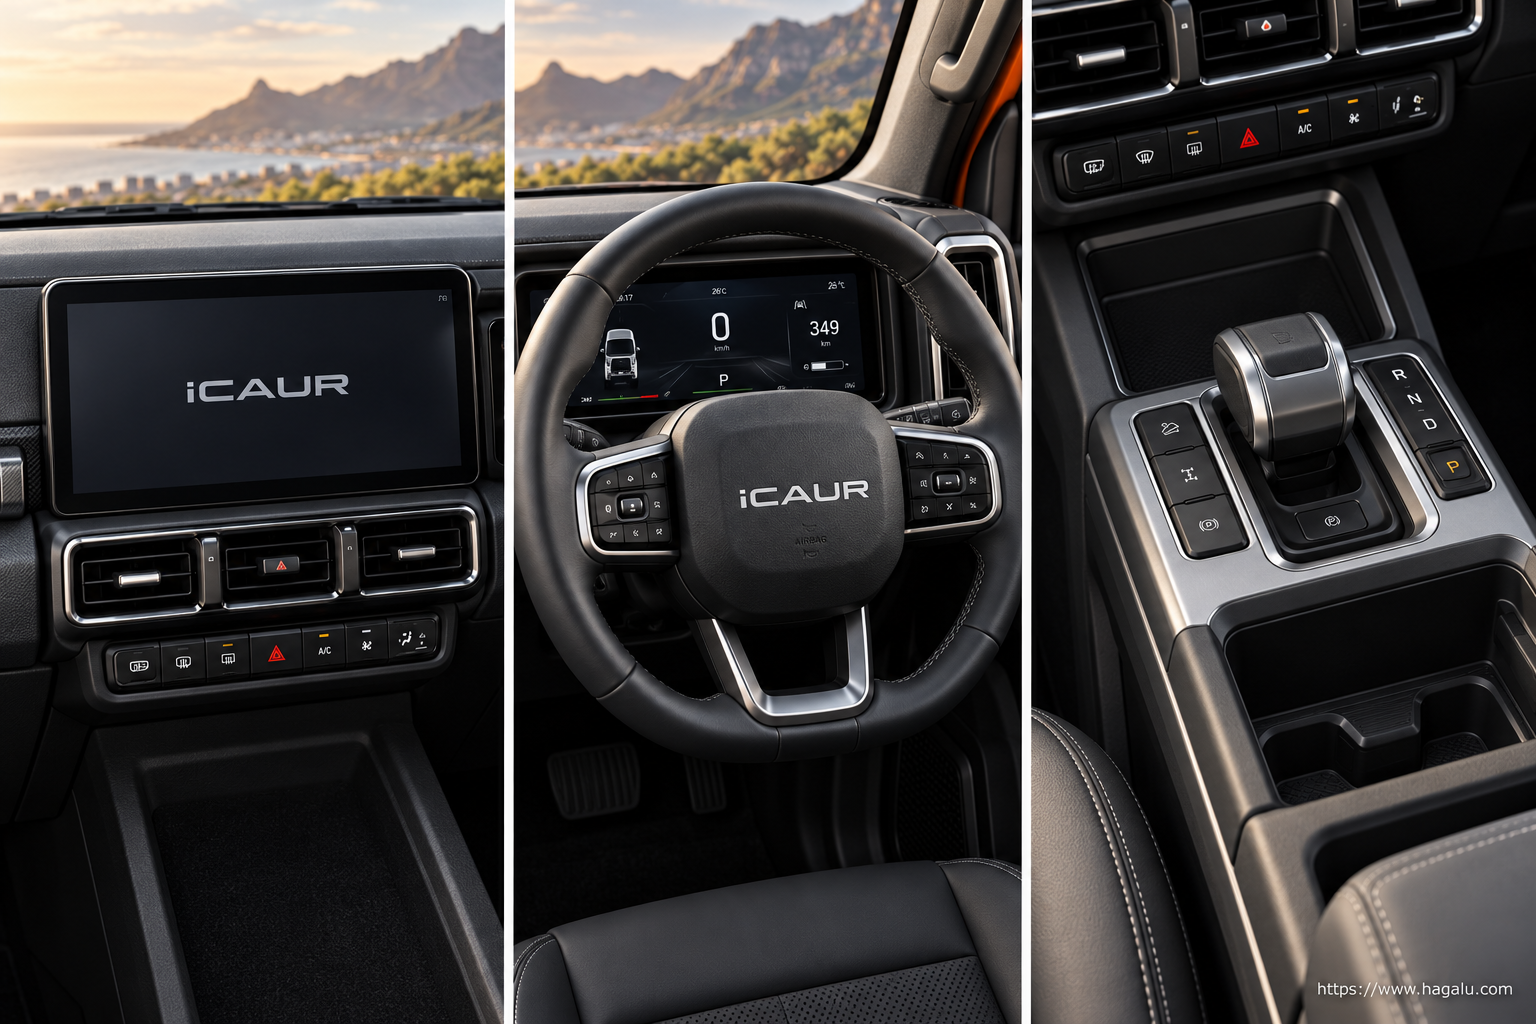
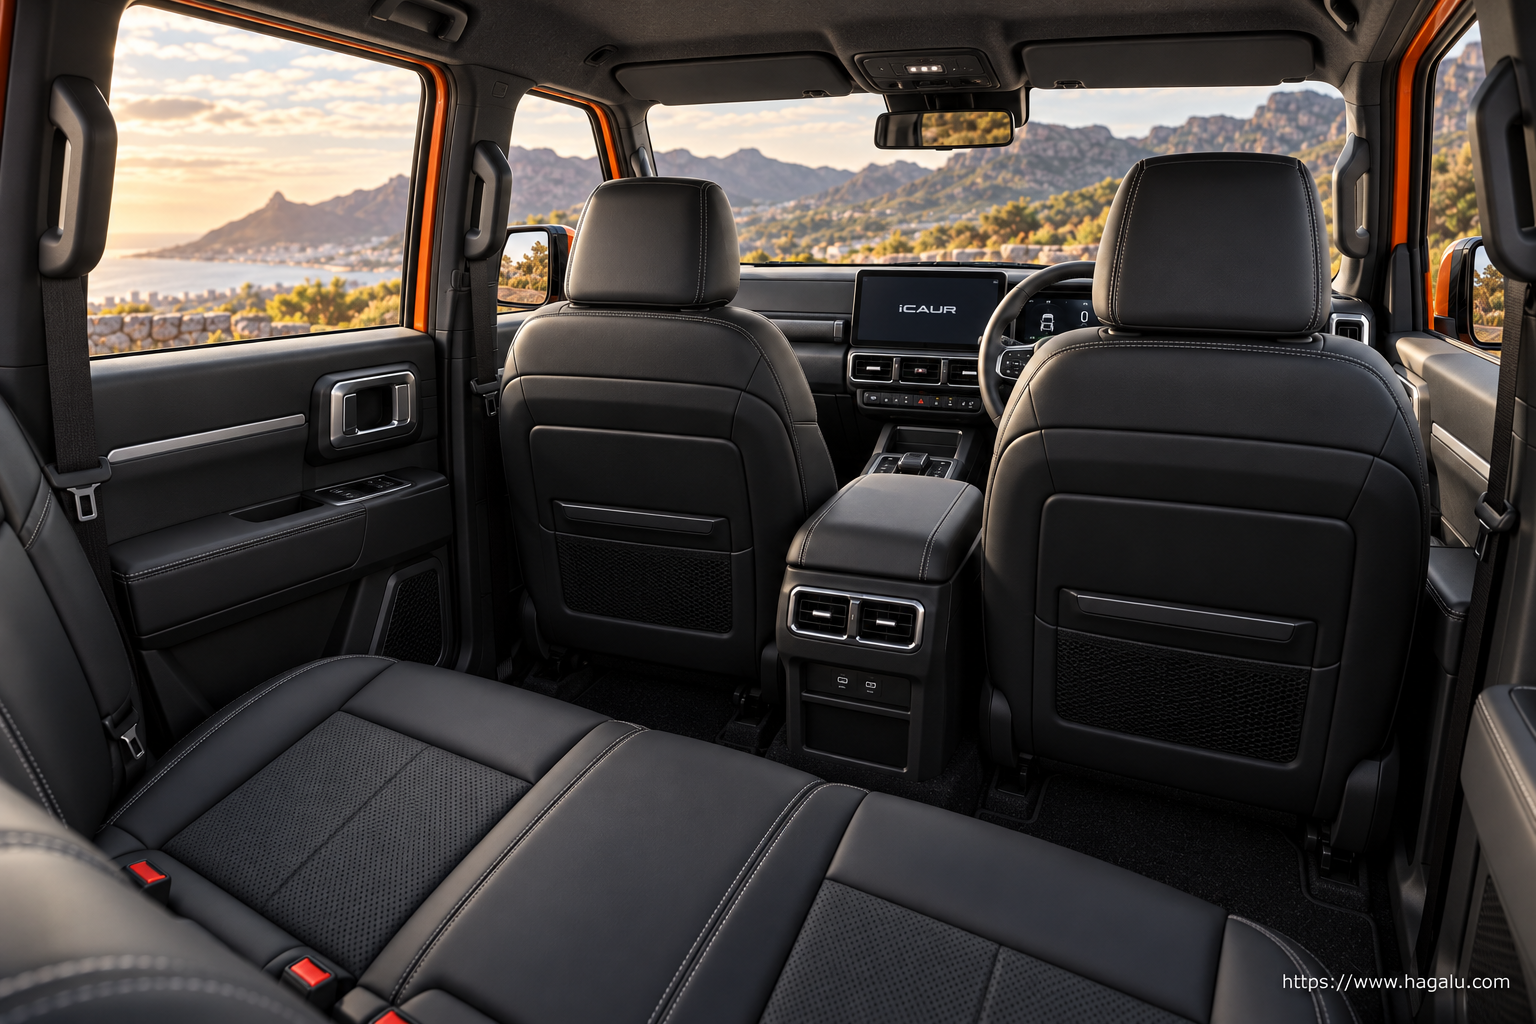
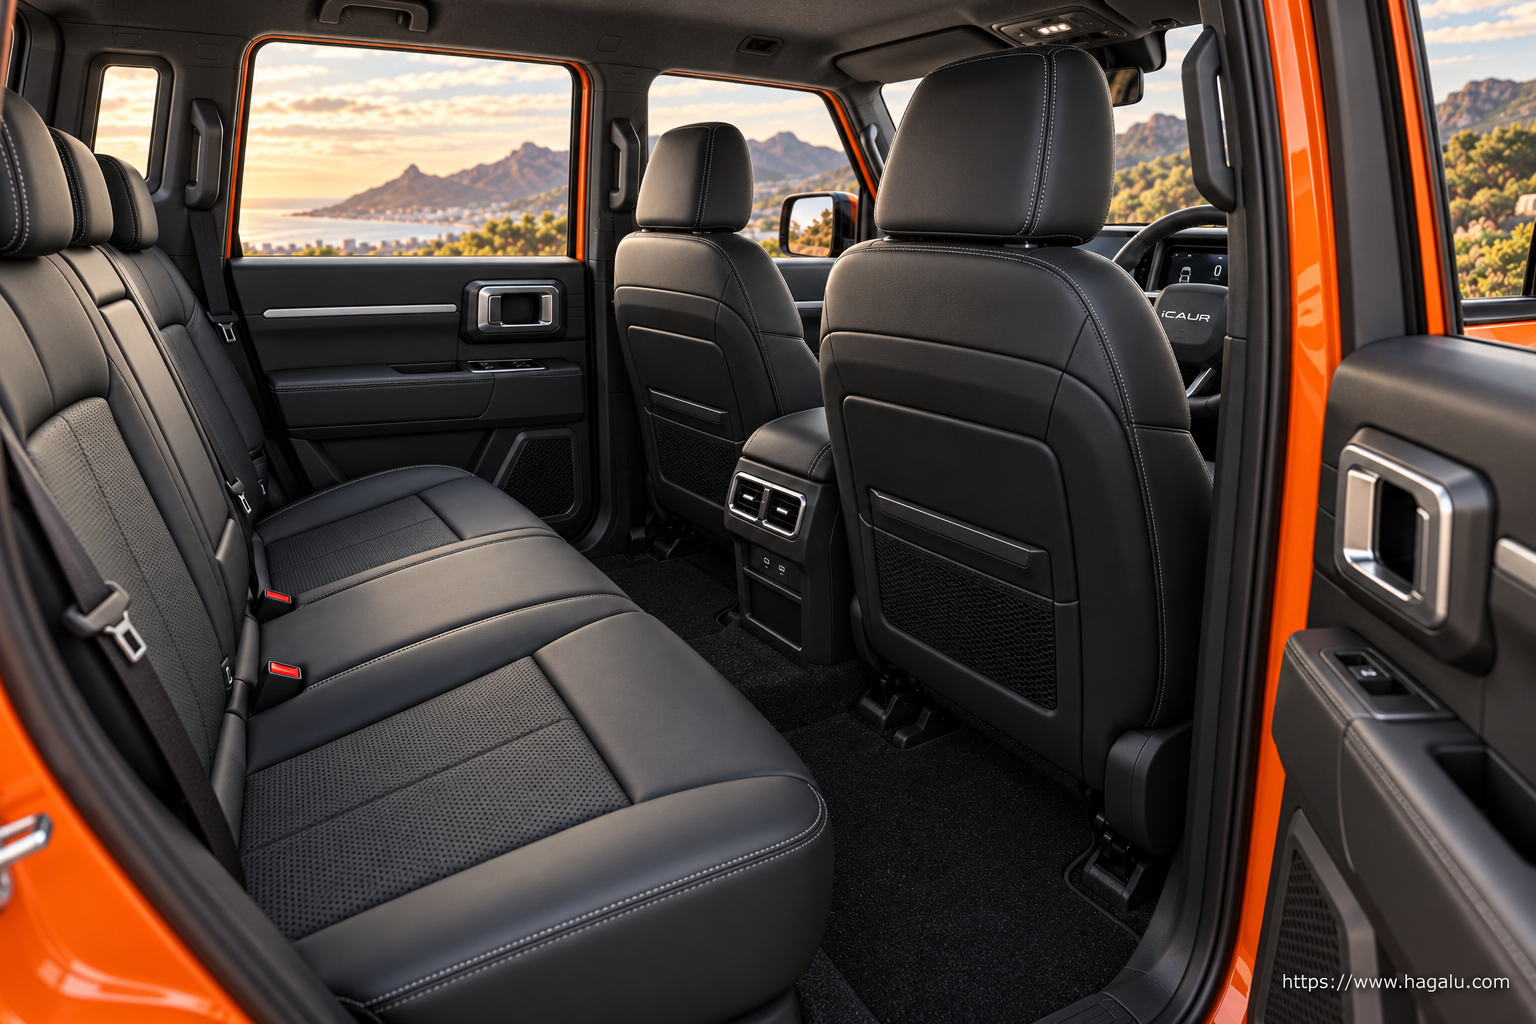
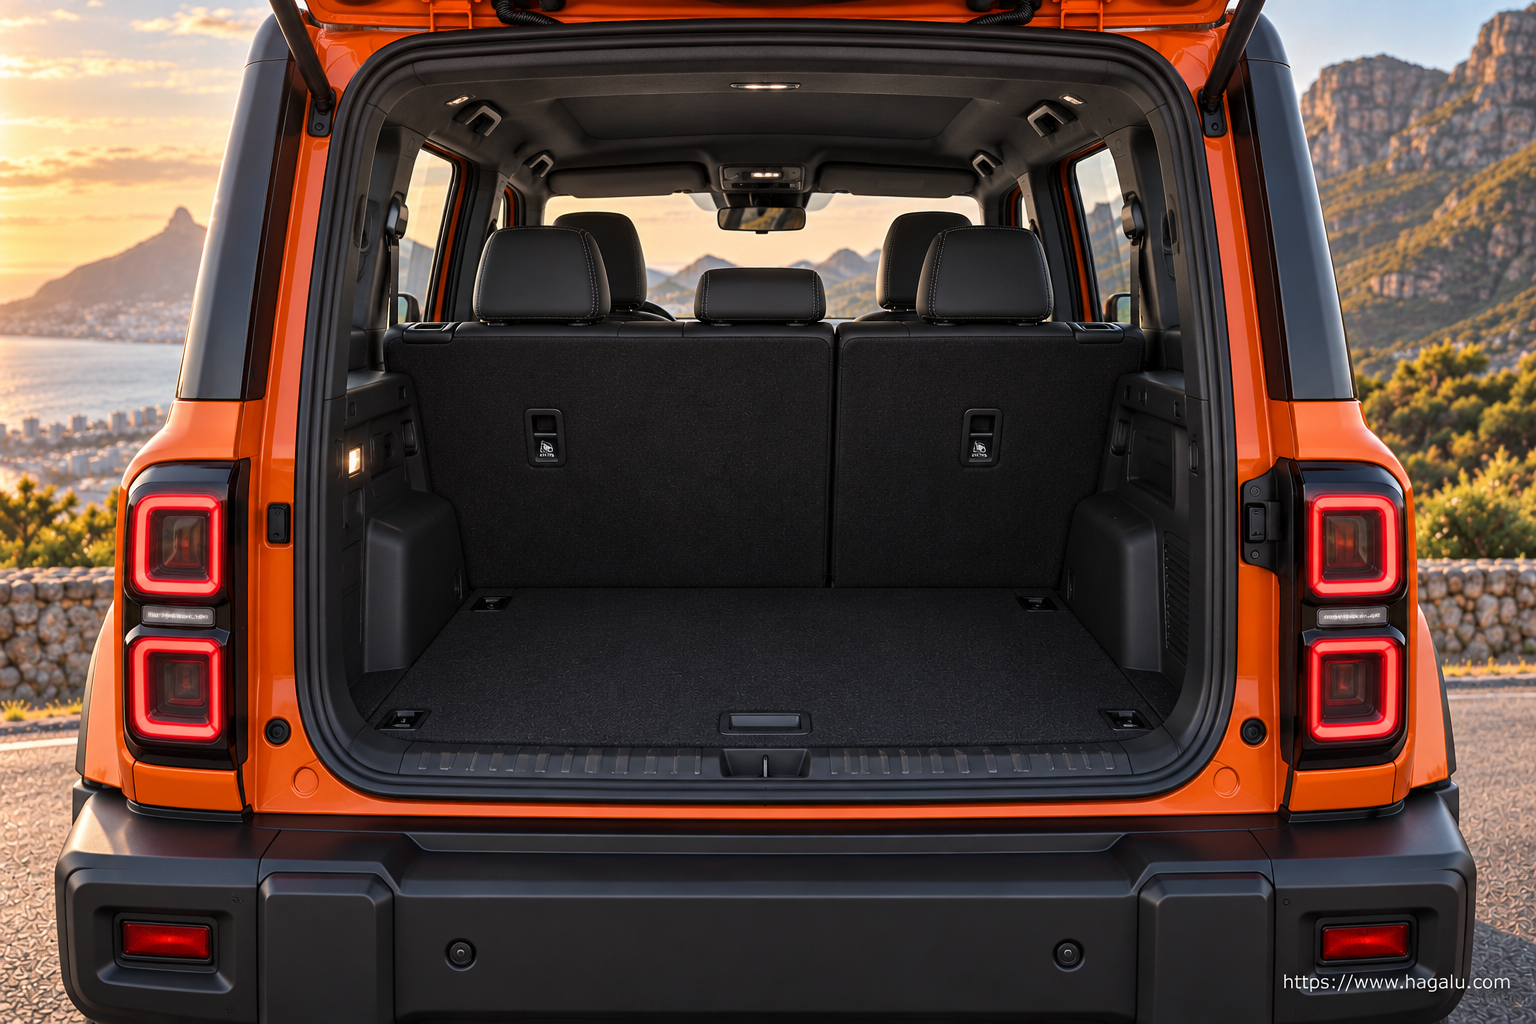
P Series and V23 image comparison
Open an image for its full canonical file or visit the model page for the complete vehicle record.
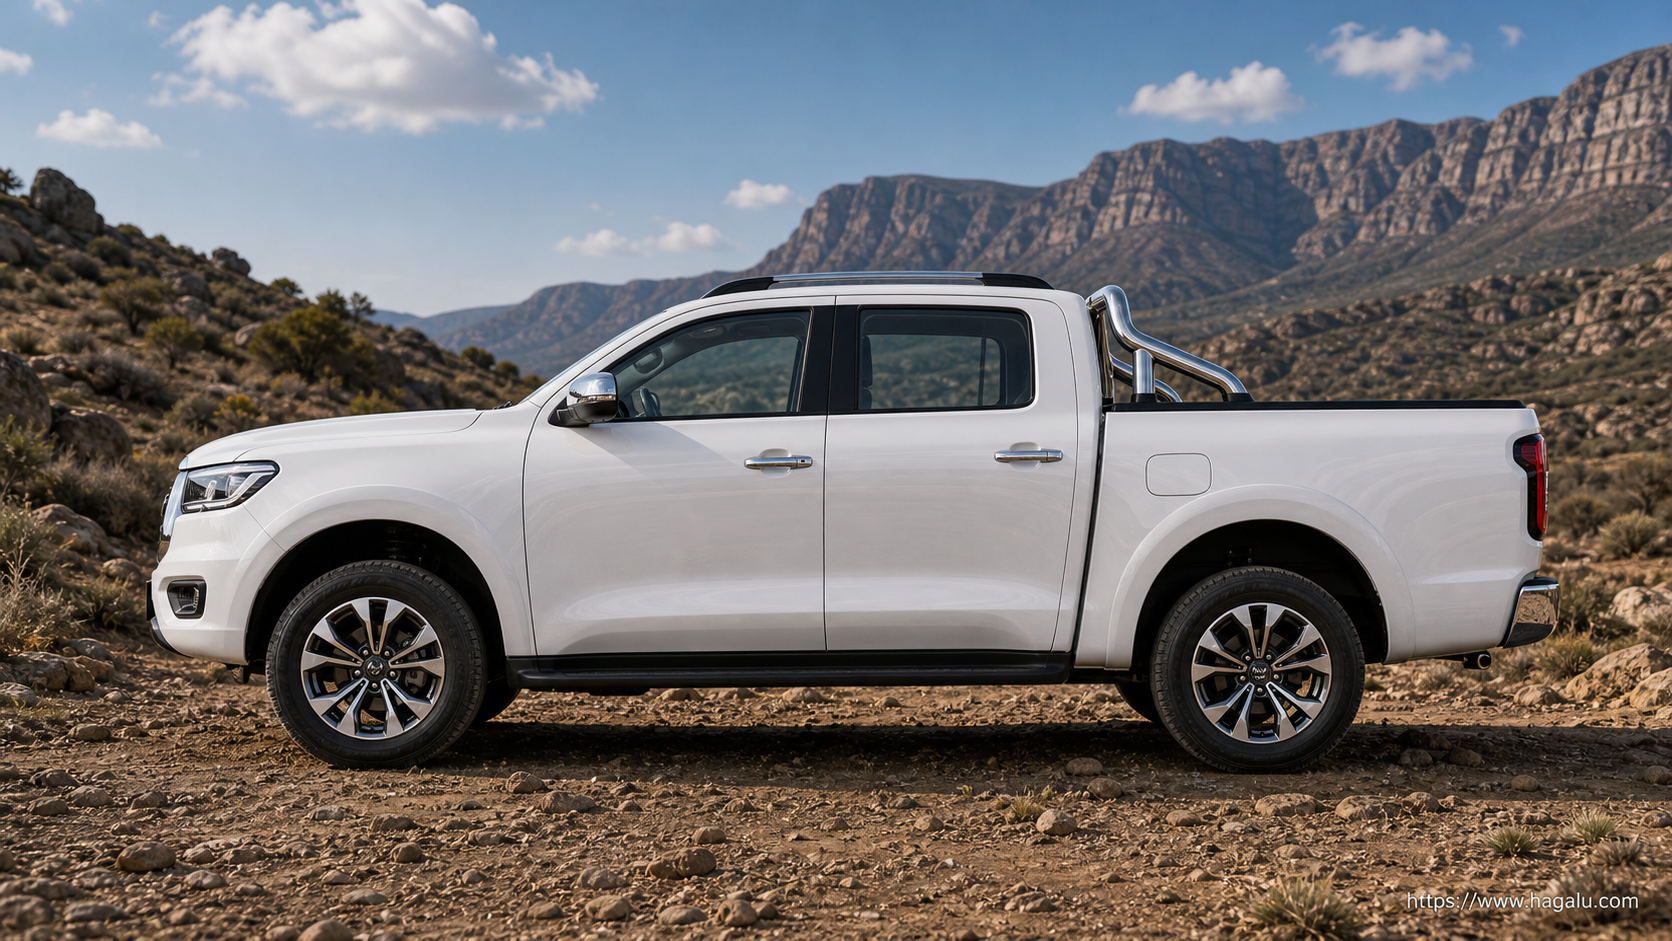
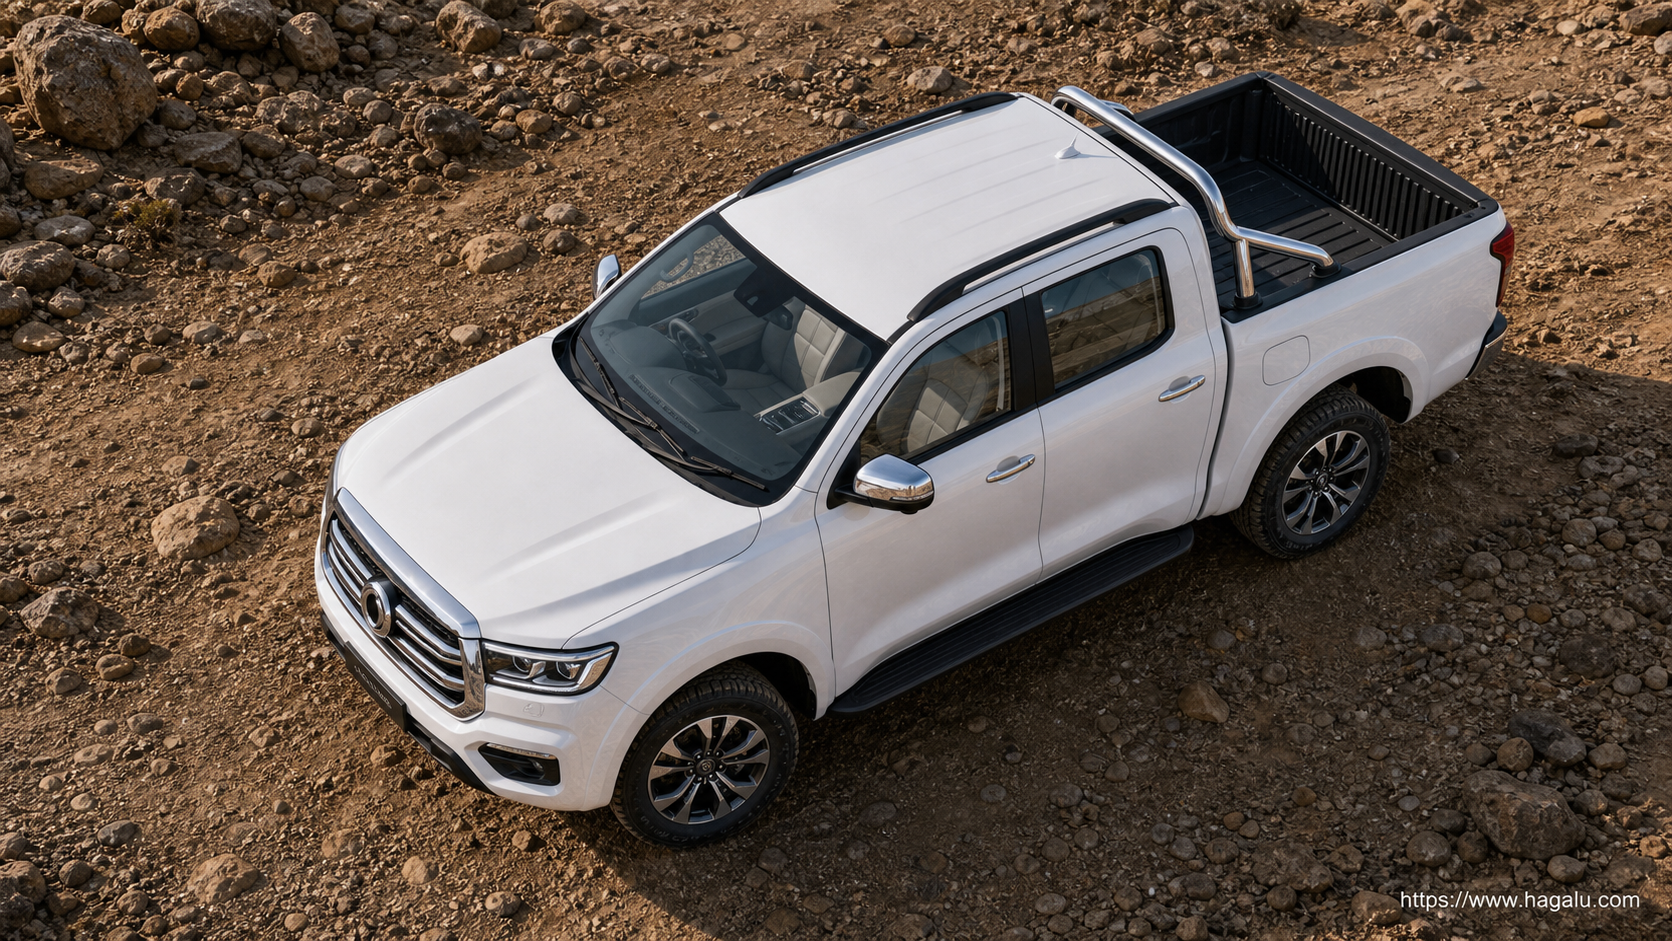
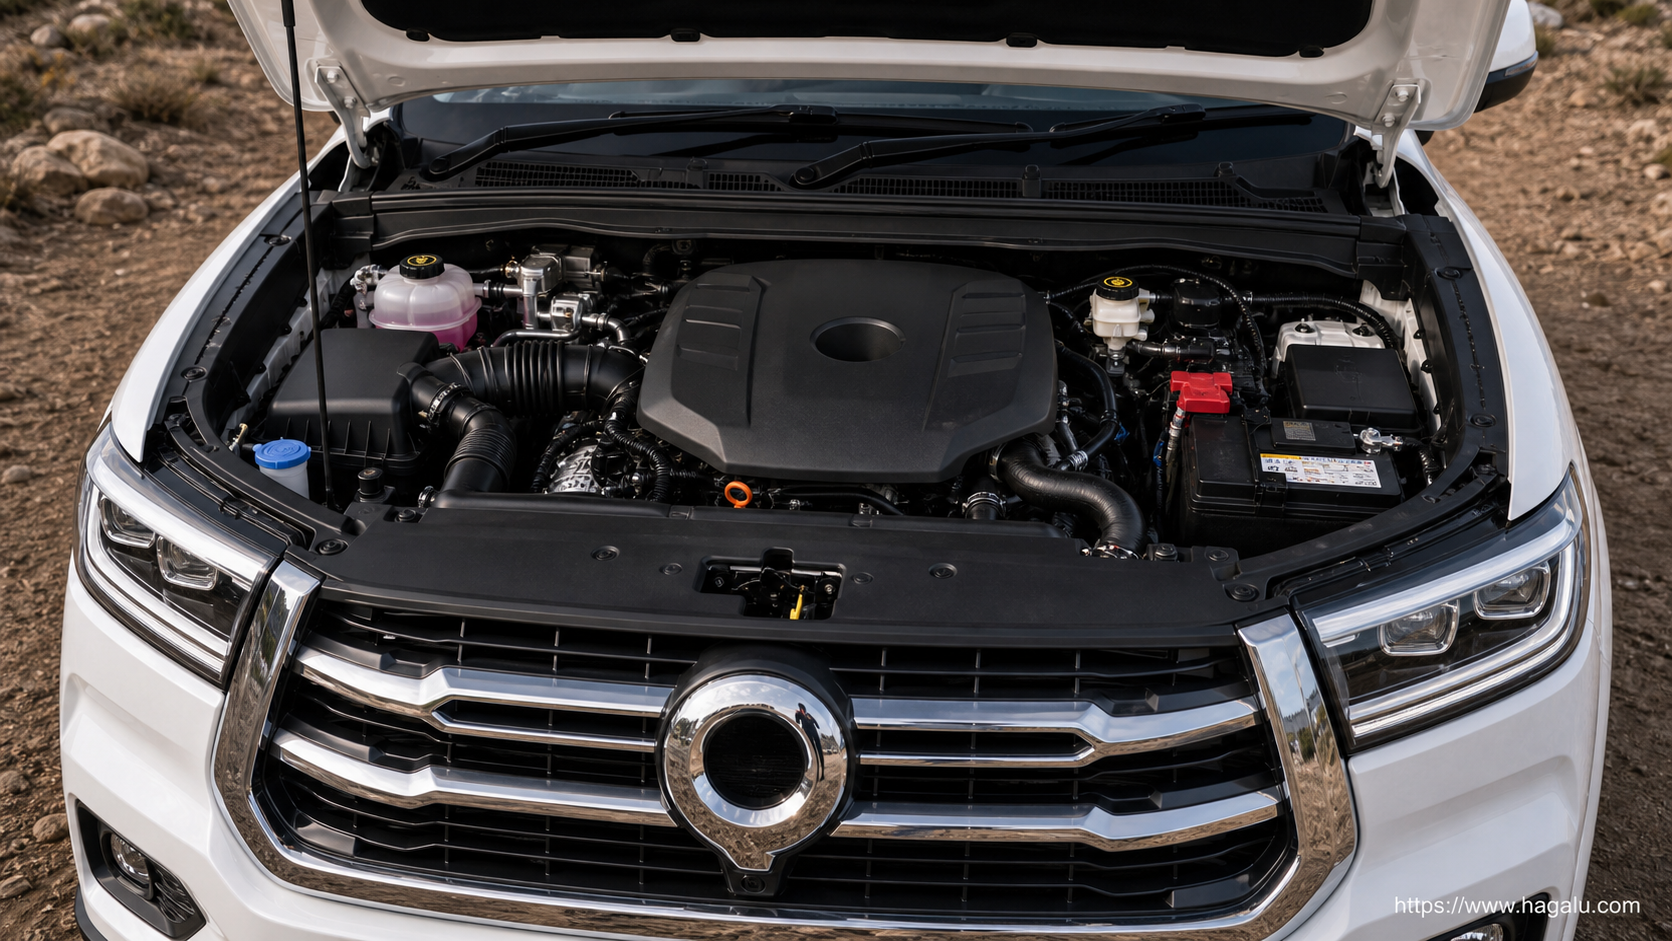
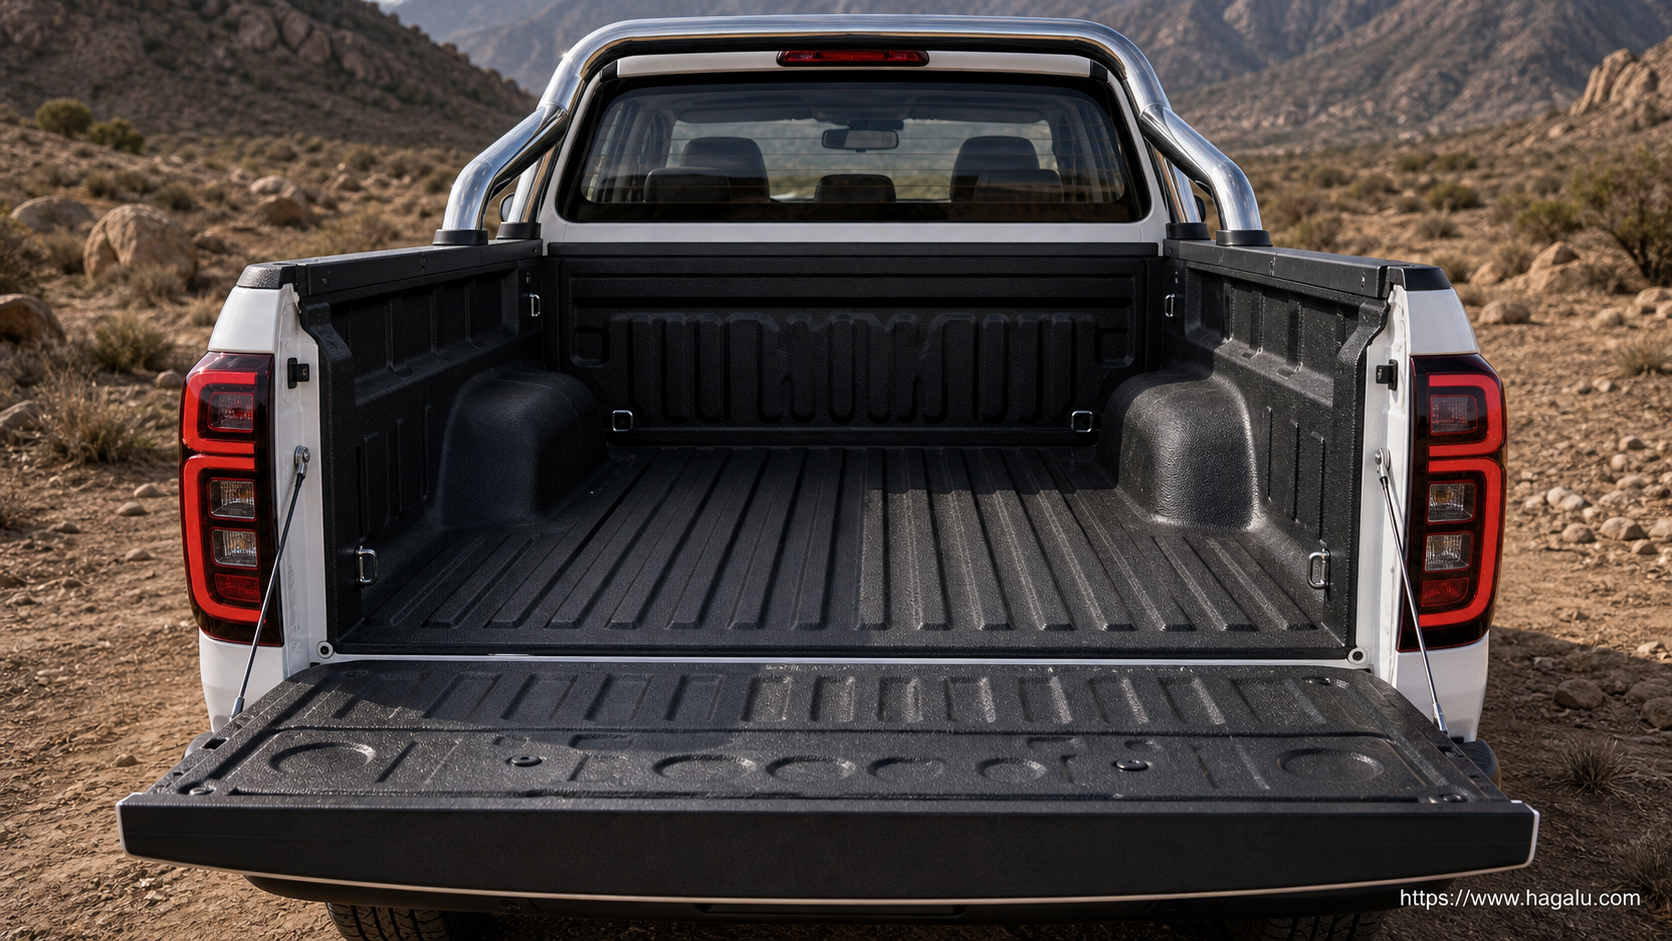
GWM P Series
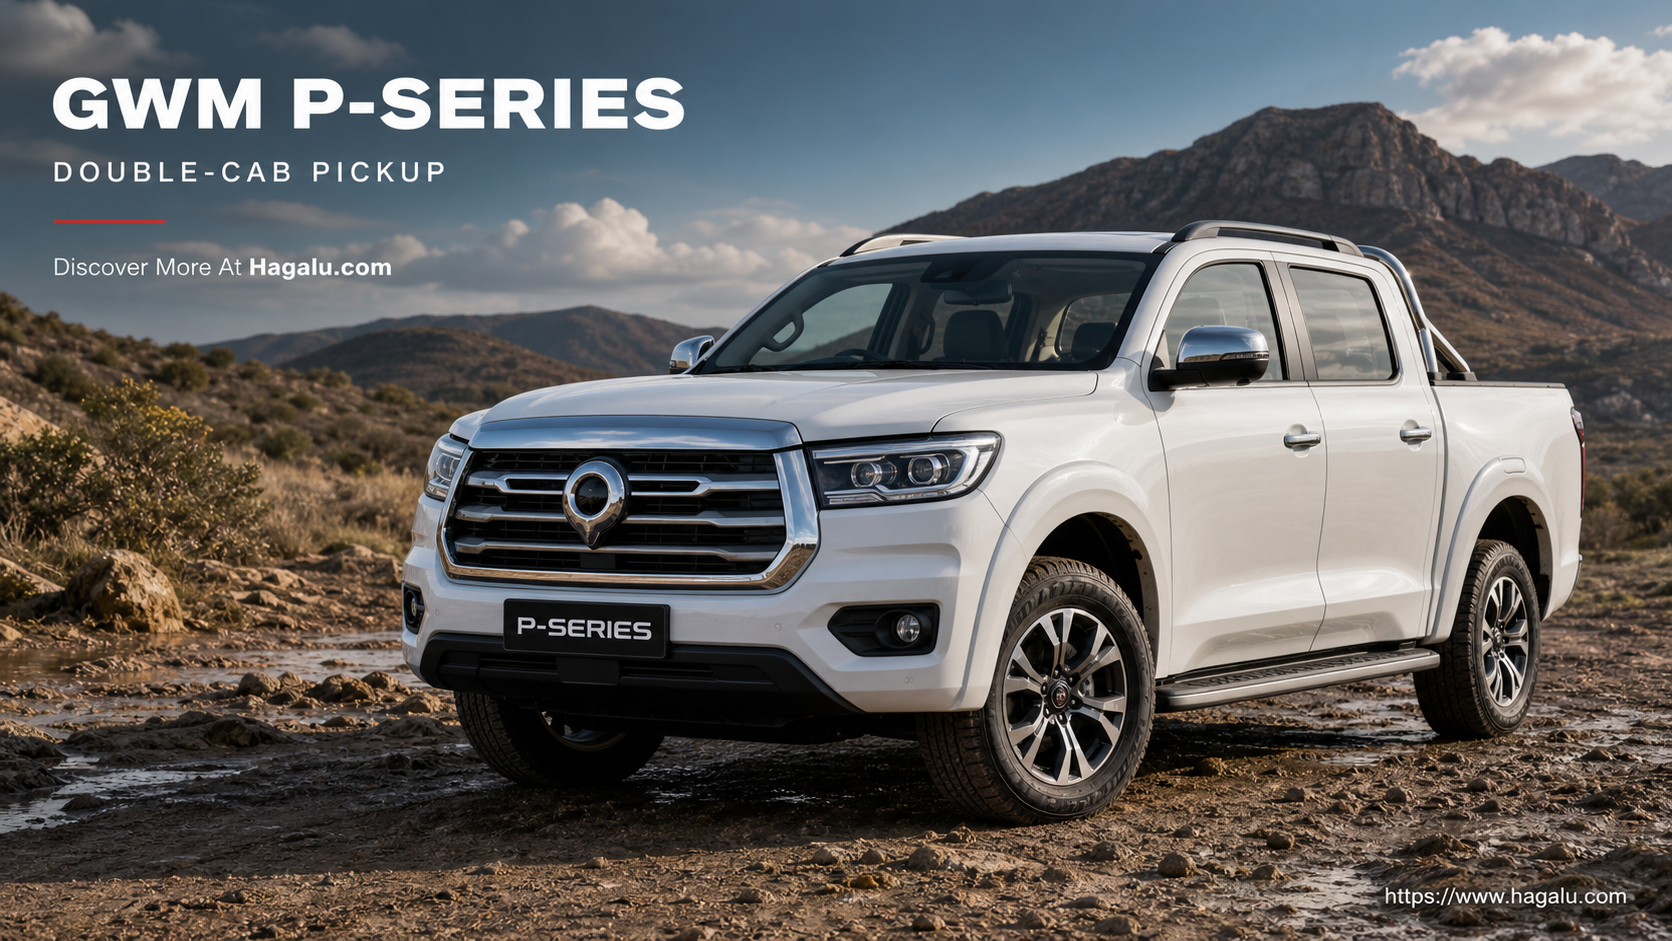
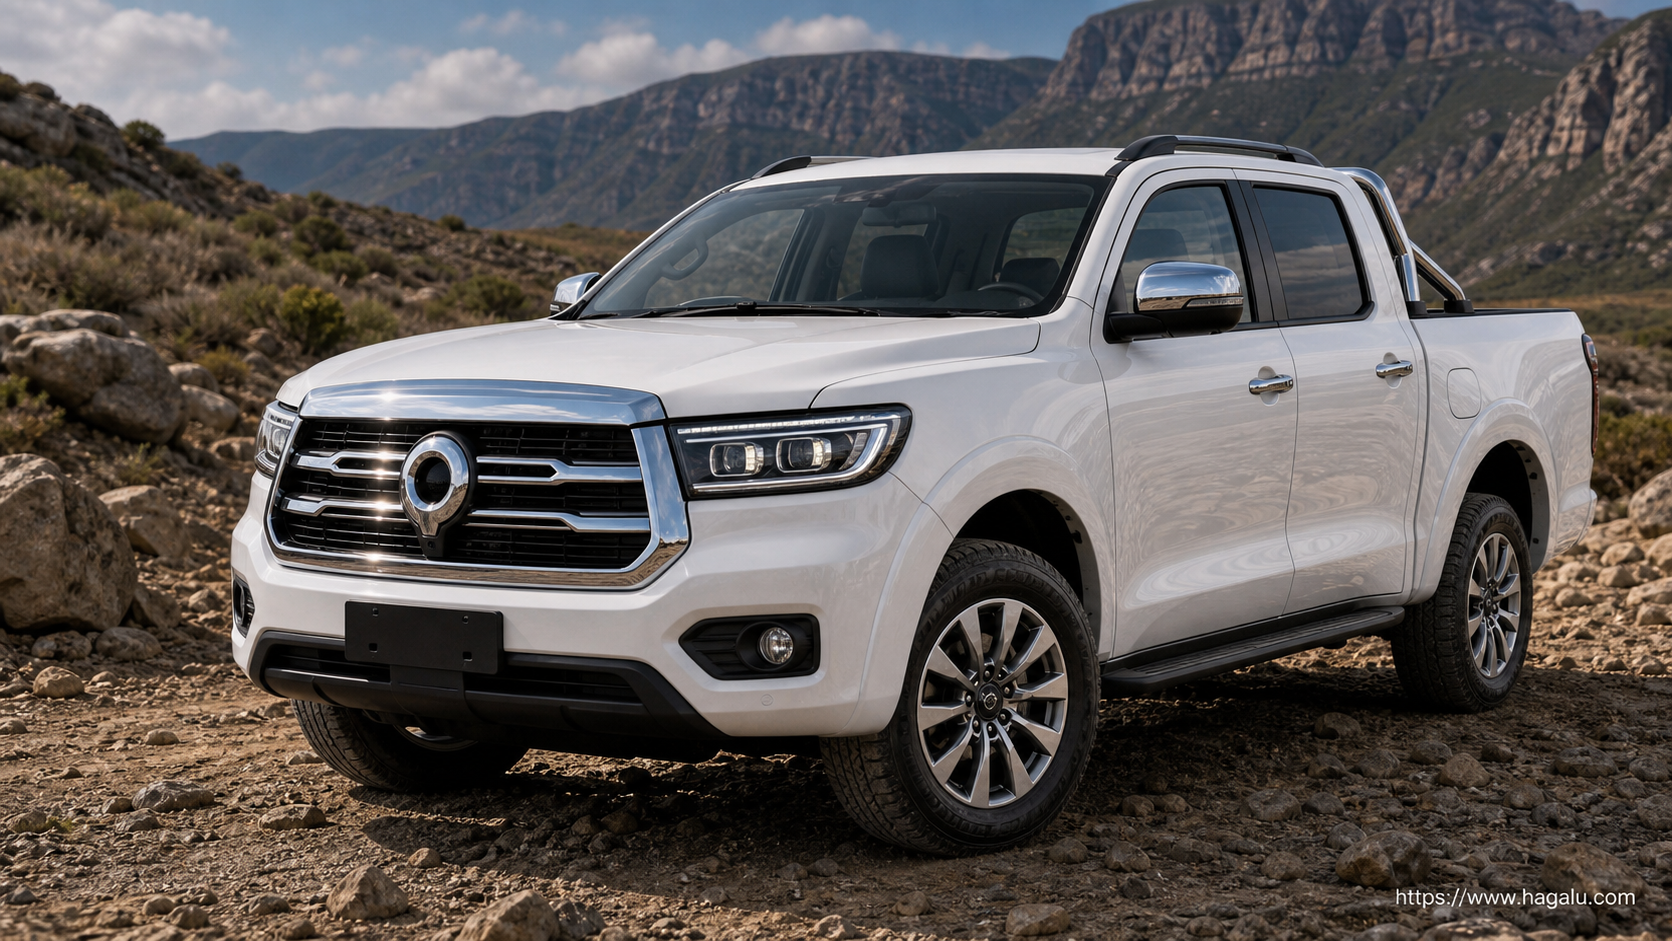
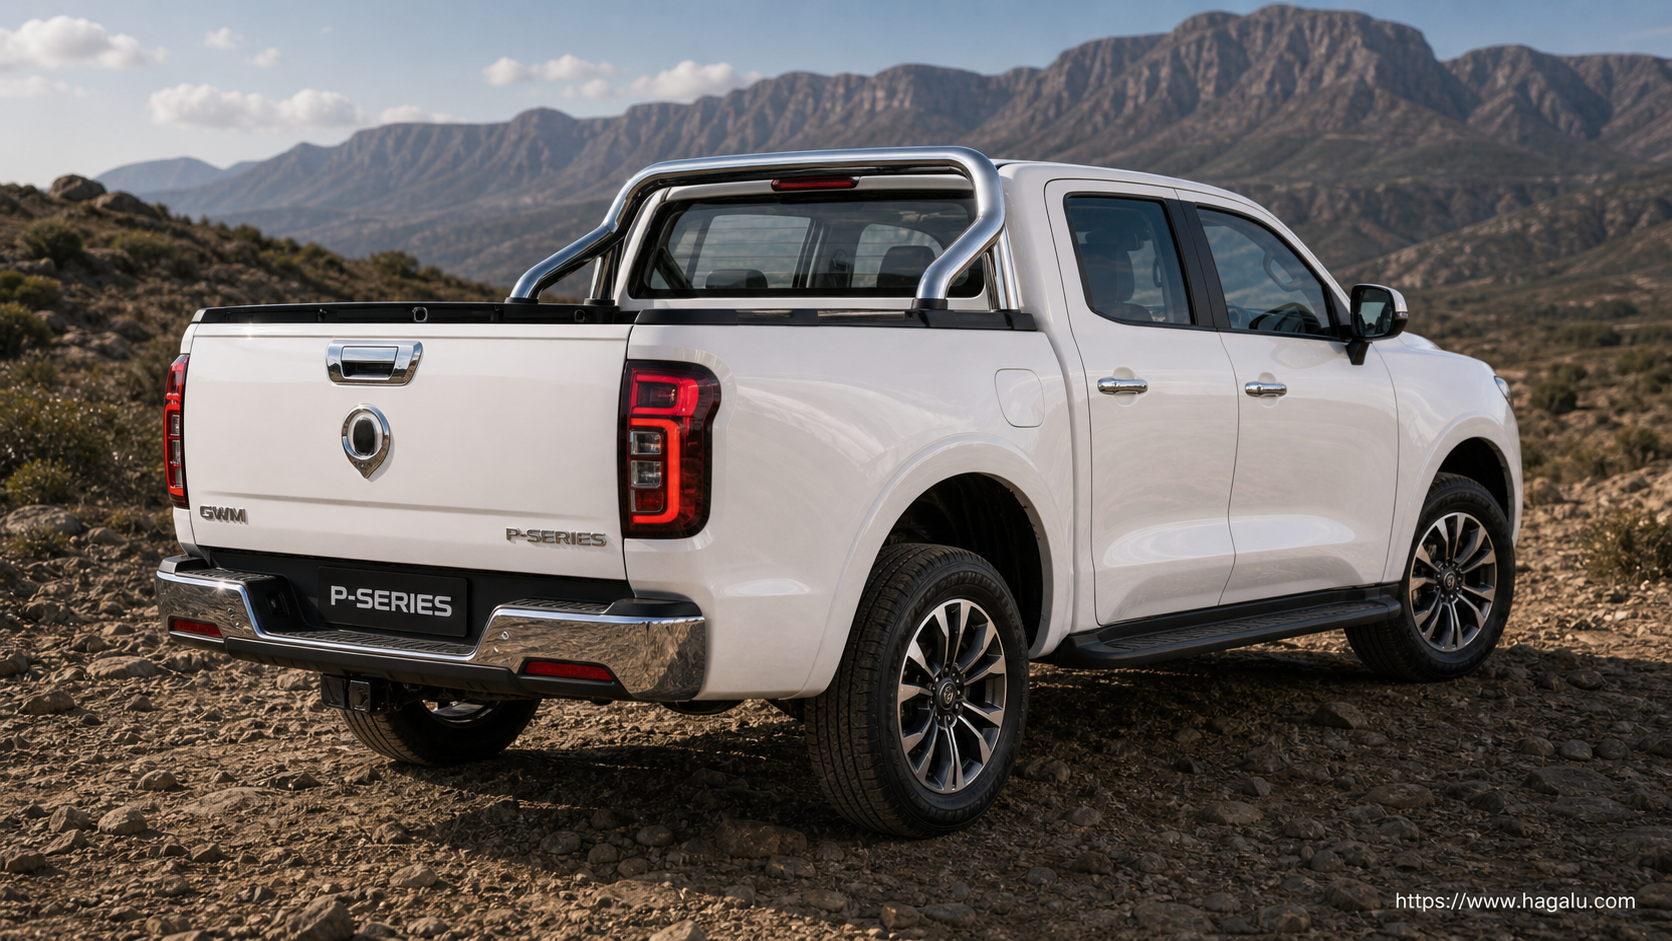
View 8 more P Series images
iCAUR V23
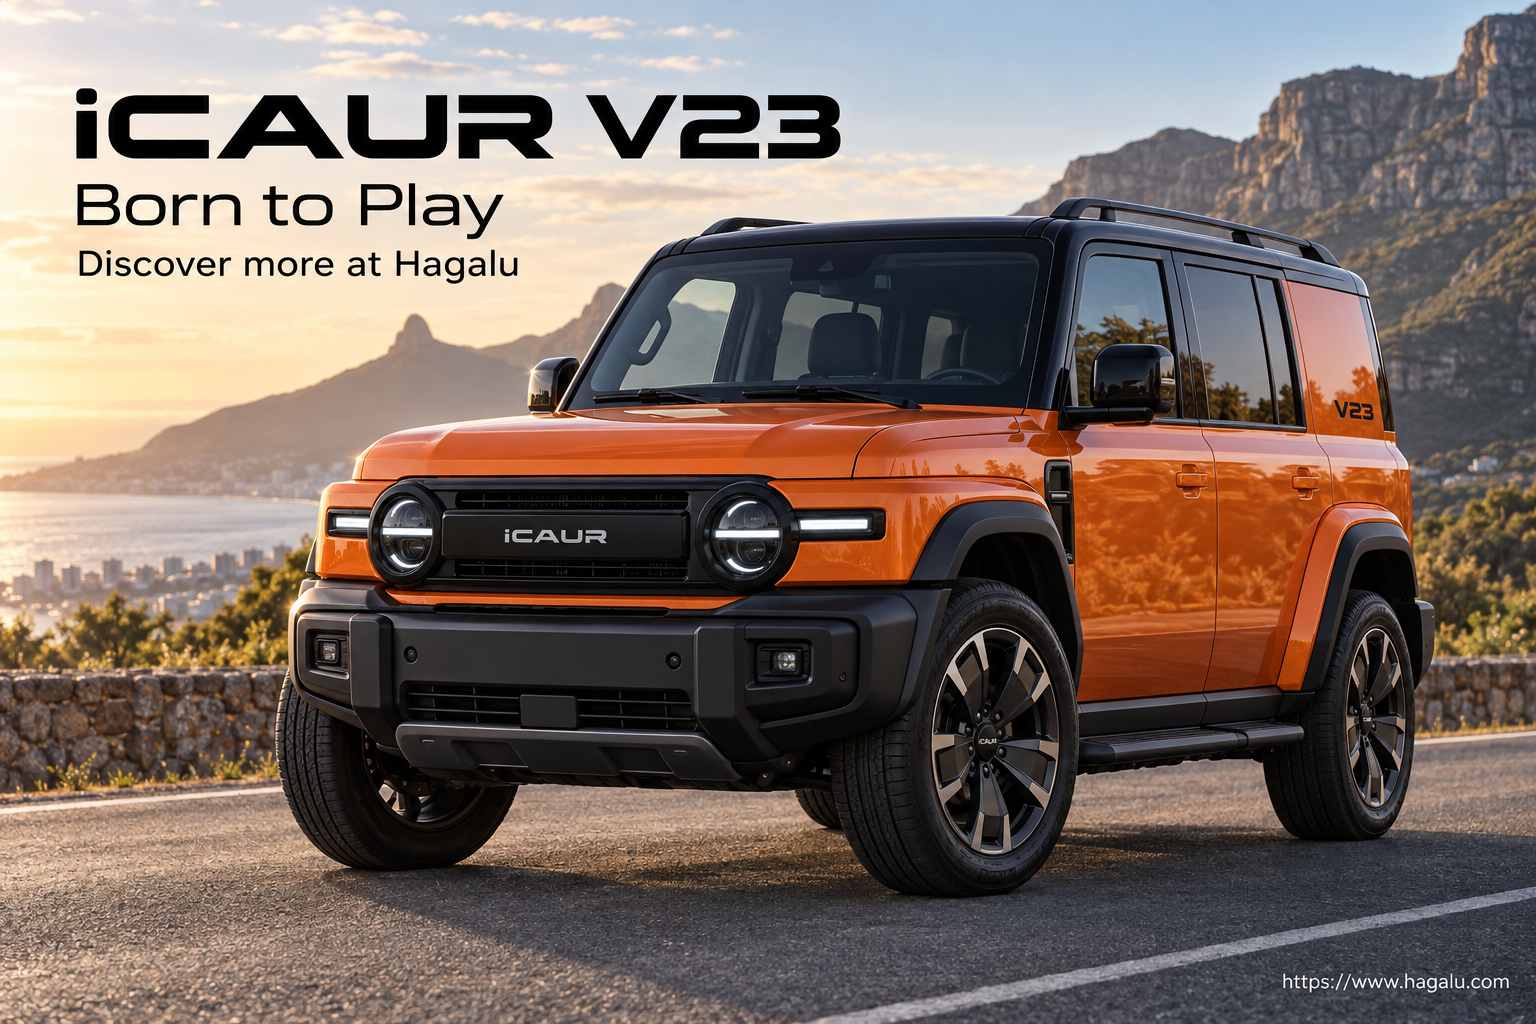
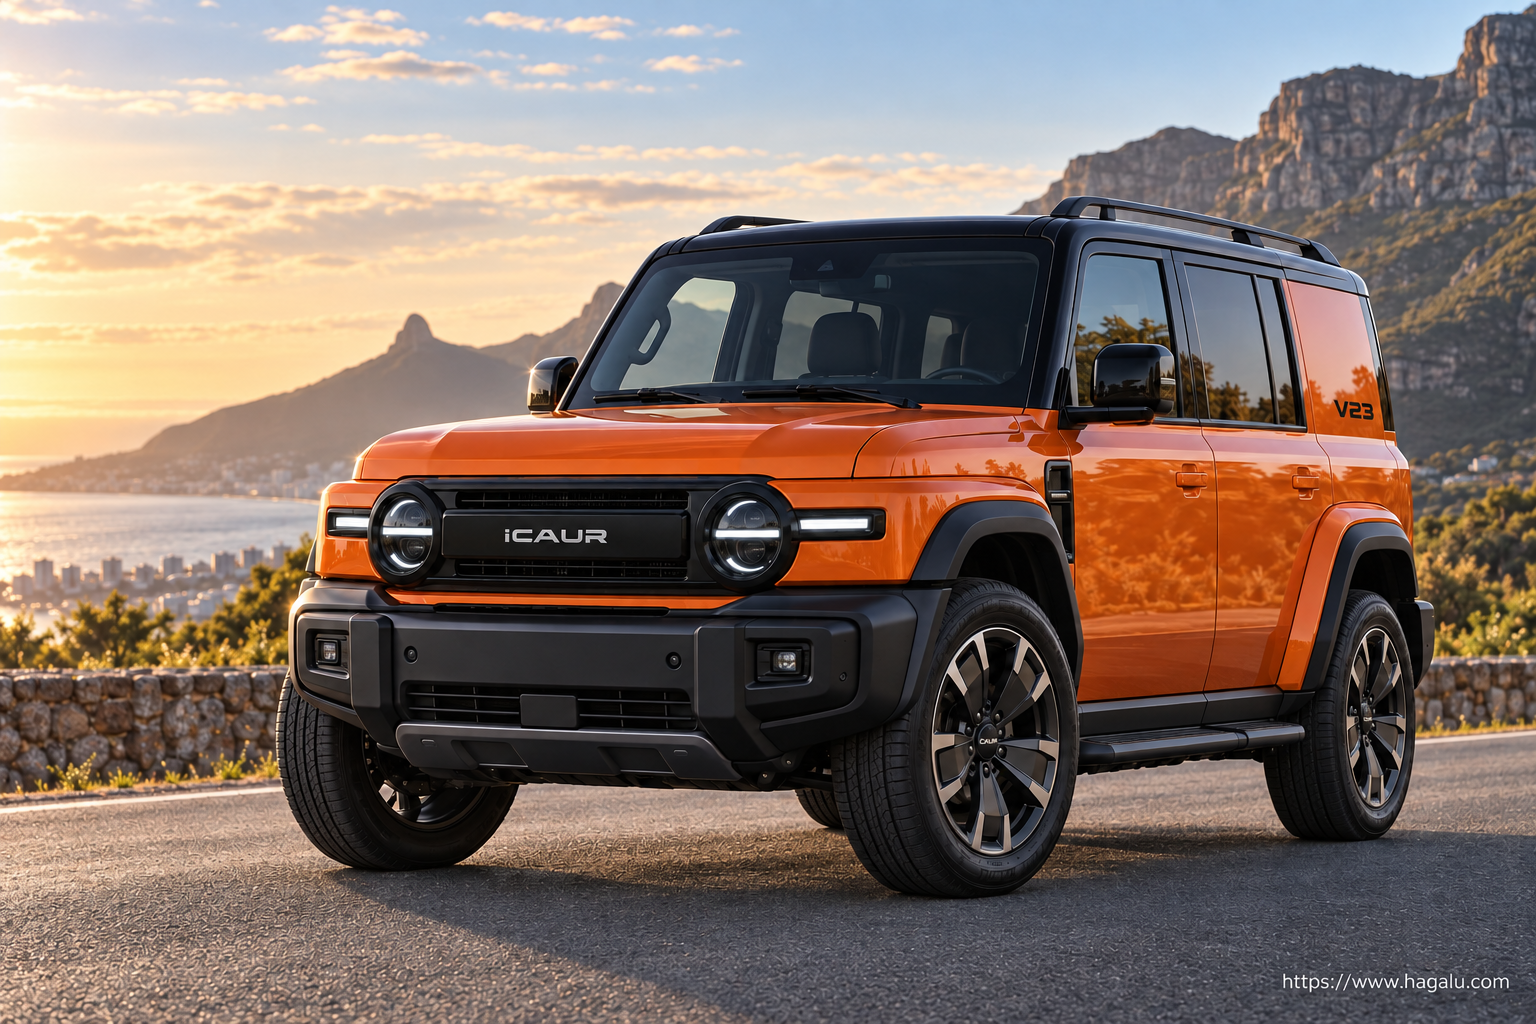
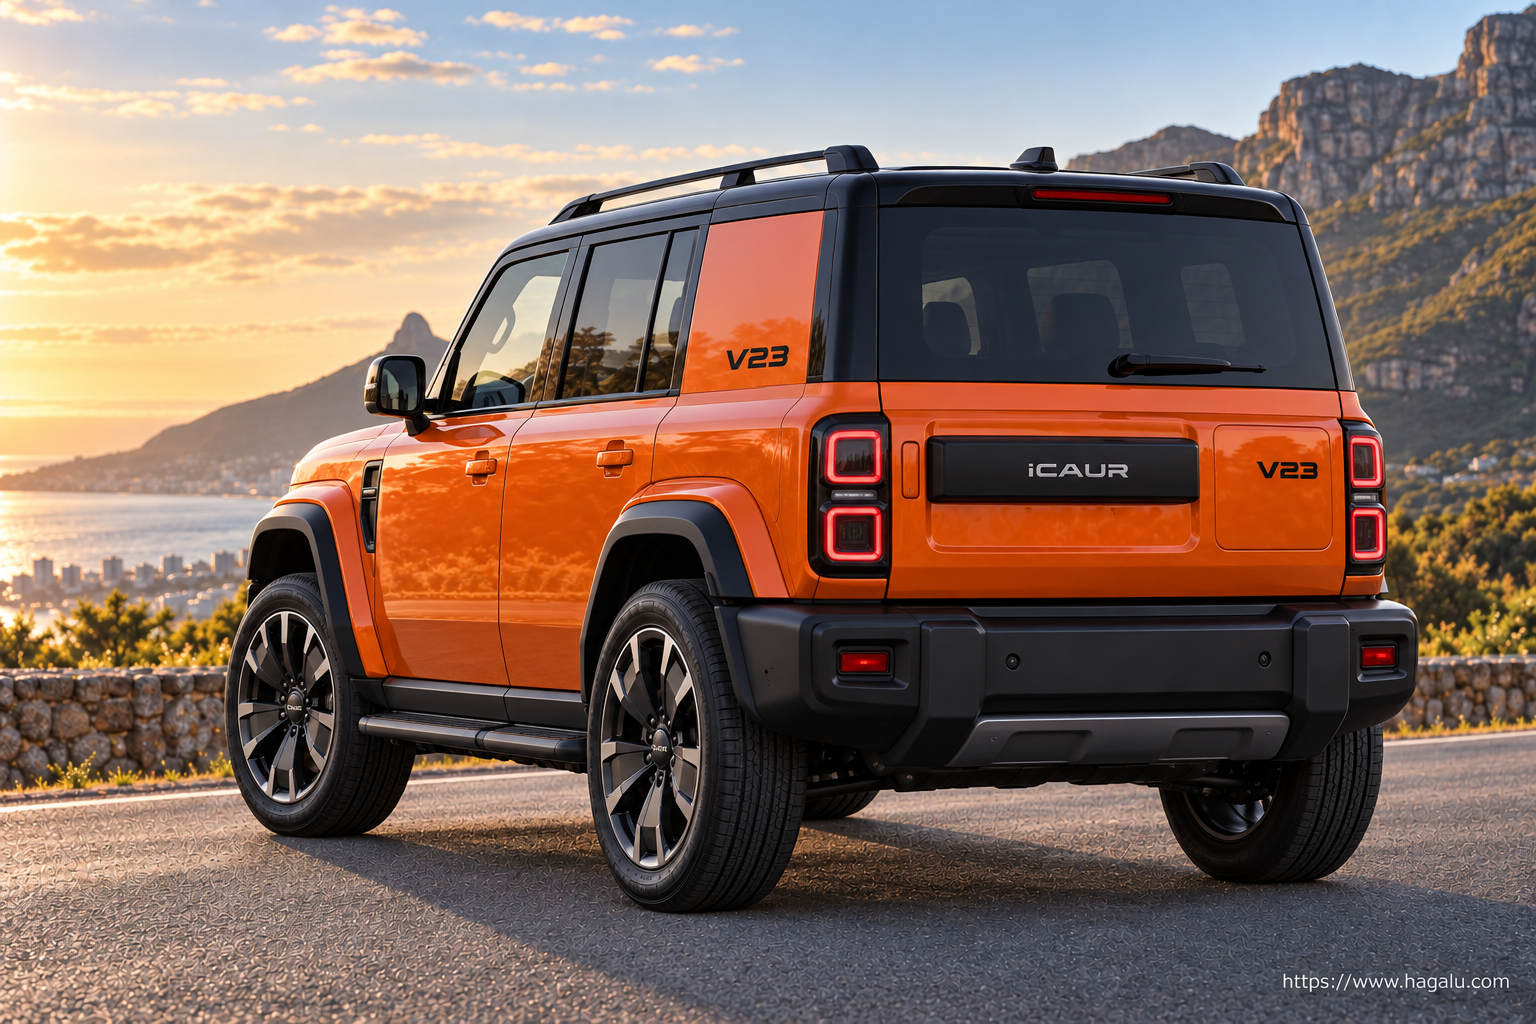
View 8 more V23 images
Specification Evidence Index
A transparent comparison of published catalogue fields. This is not a road-test score, owner rating or editorial review rating, and it appears only when every vehicle clears the same comparable-data threshold.
Evidence-index readout
V23 leads by 2 points
P Series and V23 are close on the comparable published fields, so buyer priorities should decide.
Evidence leader
71
/100
Lead
2
points
Data
67%
source coverage
71
#1
Evidence leader
V23
67% source coverage
2 strong categories
Best at
Efficiency 99
Check
Performance 42
Performance
42
Efficiency
99
Safety
93
Practicality
60
Leads by 2 points
69
#2
P Series
94% source coverage
2 strong categories
Best at
Safety 91
Check
Efficiency 41
Performance
61
Efficiency
41
Safety
91
Practicality
81
Ownership
65
Performance 24%
Safety 22%
Practicality 22%
Efficiency 17%
Ownership 15%
Category leaders
What moves the verdict
Performance
P Series +19
Efficiency
V23 +58
Safety
V23 +2
Practicality
P Series +21
Close catalogue match. Buyer priorities should decide the outcome.
Why this score View full breakdown
Evidence-index leader
V23
Performance
42/100
Efficiency
99/100
Safety
93/100
Practicality
60/100
P Series
Performance
61/100
Efficiency
41/100
Safety
91/100
Practicality
81/100
Ownership
65/100
What the evidence means
Evidence index
iCAUR V23
leads the specification evidence index with 71 pts
vs 69 pts for P Series
In Hagalu's specification evidence index, V23 leads. However, P Series may suit buyers prioritising different confirmed fields. Ultimately, the right choice depends on your driving priorities in South Africa.
Related comparisons
Continue with closely related South Africa models and comparable body styles.
P SeriesDiscontinued
VS

T60 Double Cab
P Series vs T60 Double Cab
→
P SeriesDiscontinued
VS

S6 Mining
P Series vs S6 Mining
→
P SeriesDiscontinued
VS
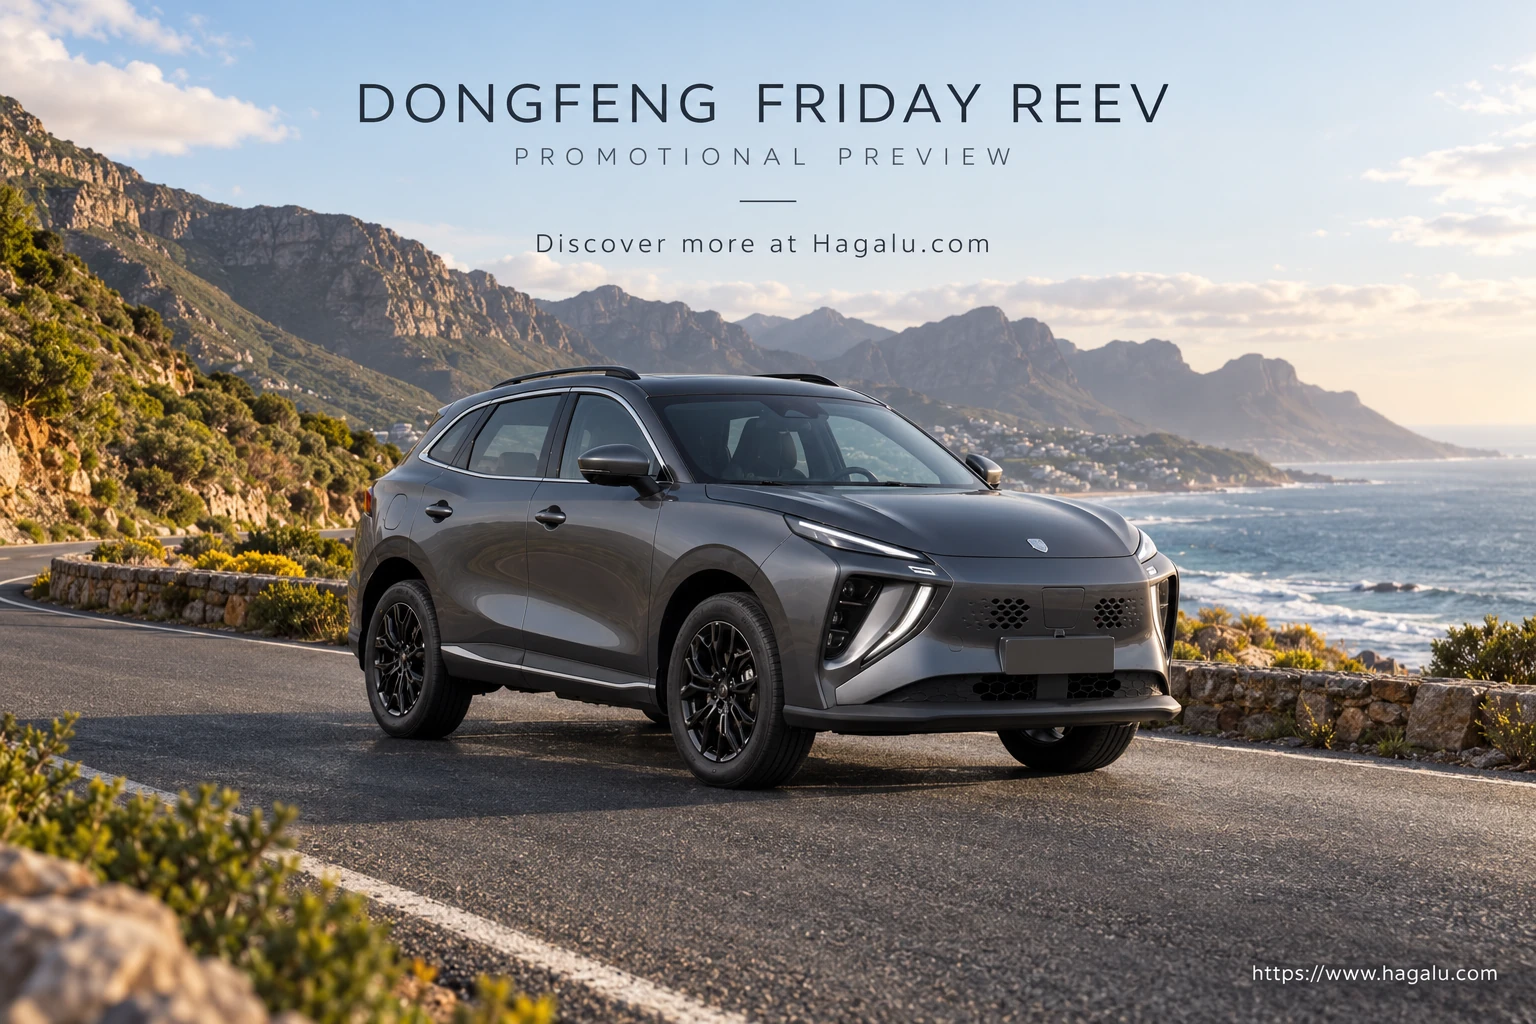
FRIDAY REEV
P Series vs FRIDAY REEV
→
P SeriesDiscontinued
VS
HR-V
P Series vs HR-V
→
P SeriesDiscontinued
VS
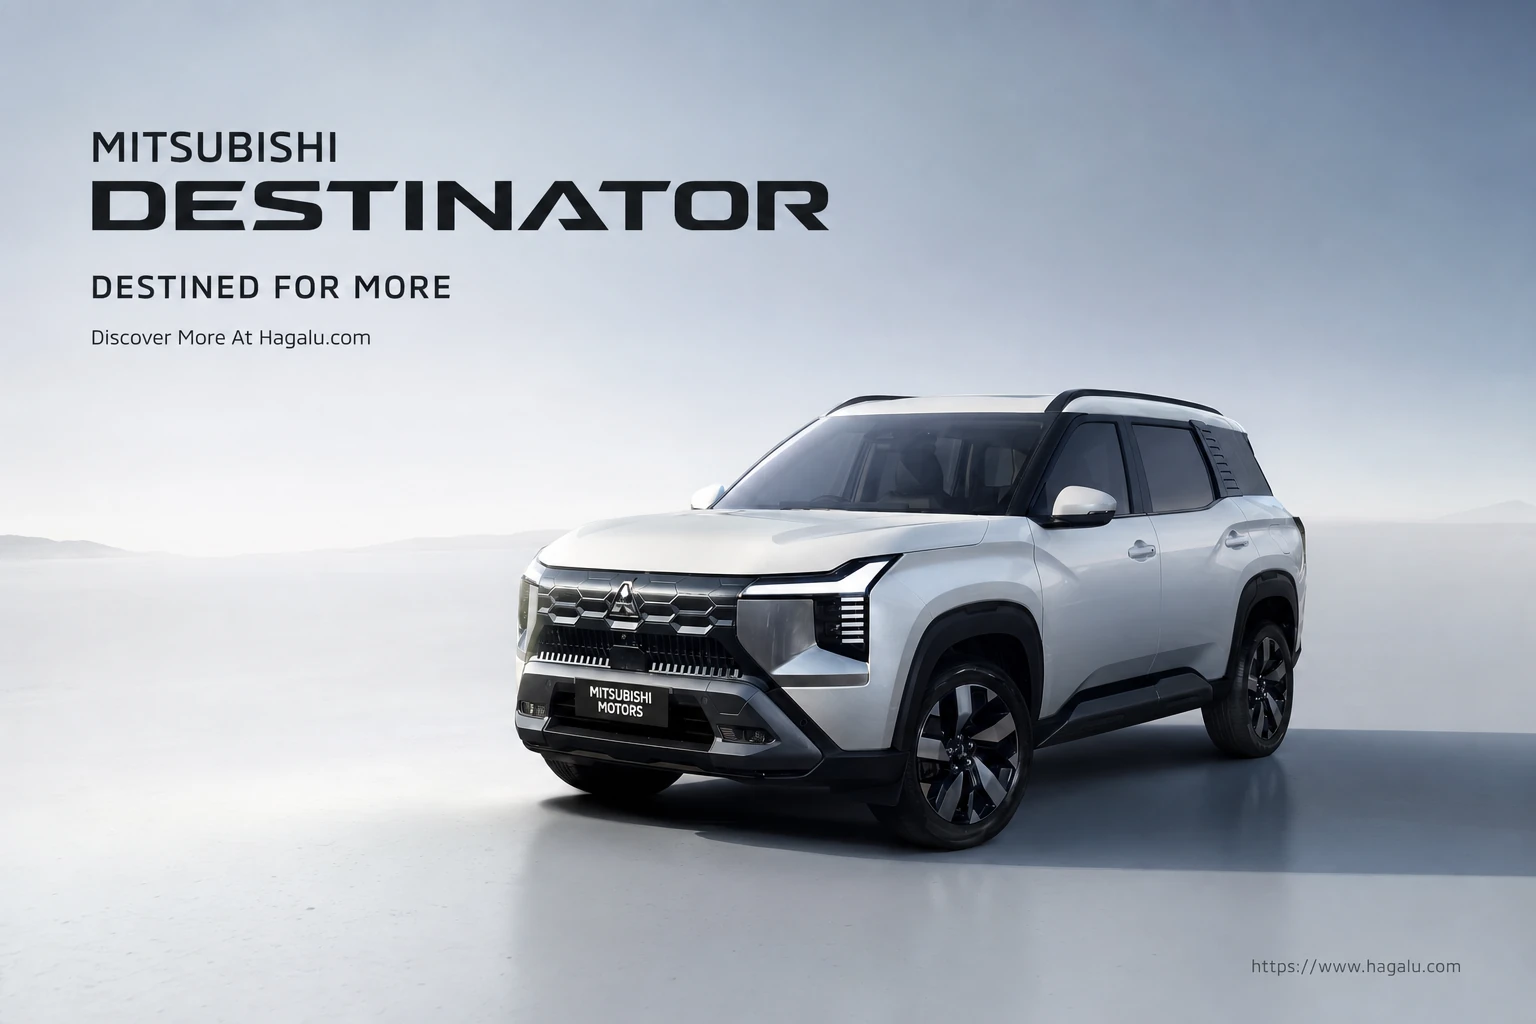
Destinator
P Series vs Destinator
→
P SeriesDiscontinued
VS
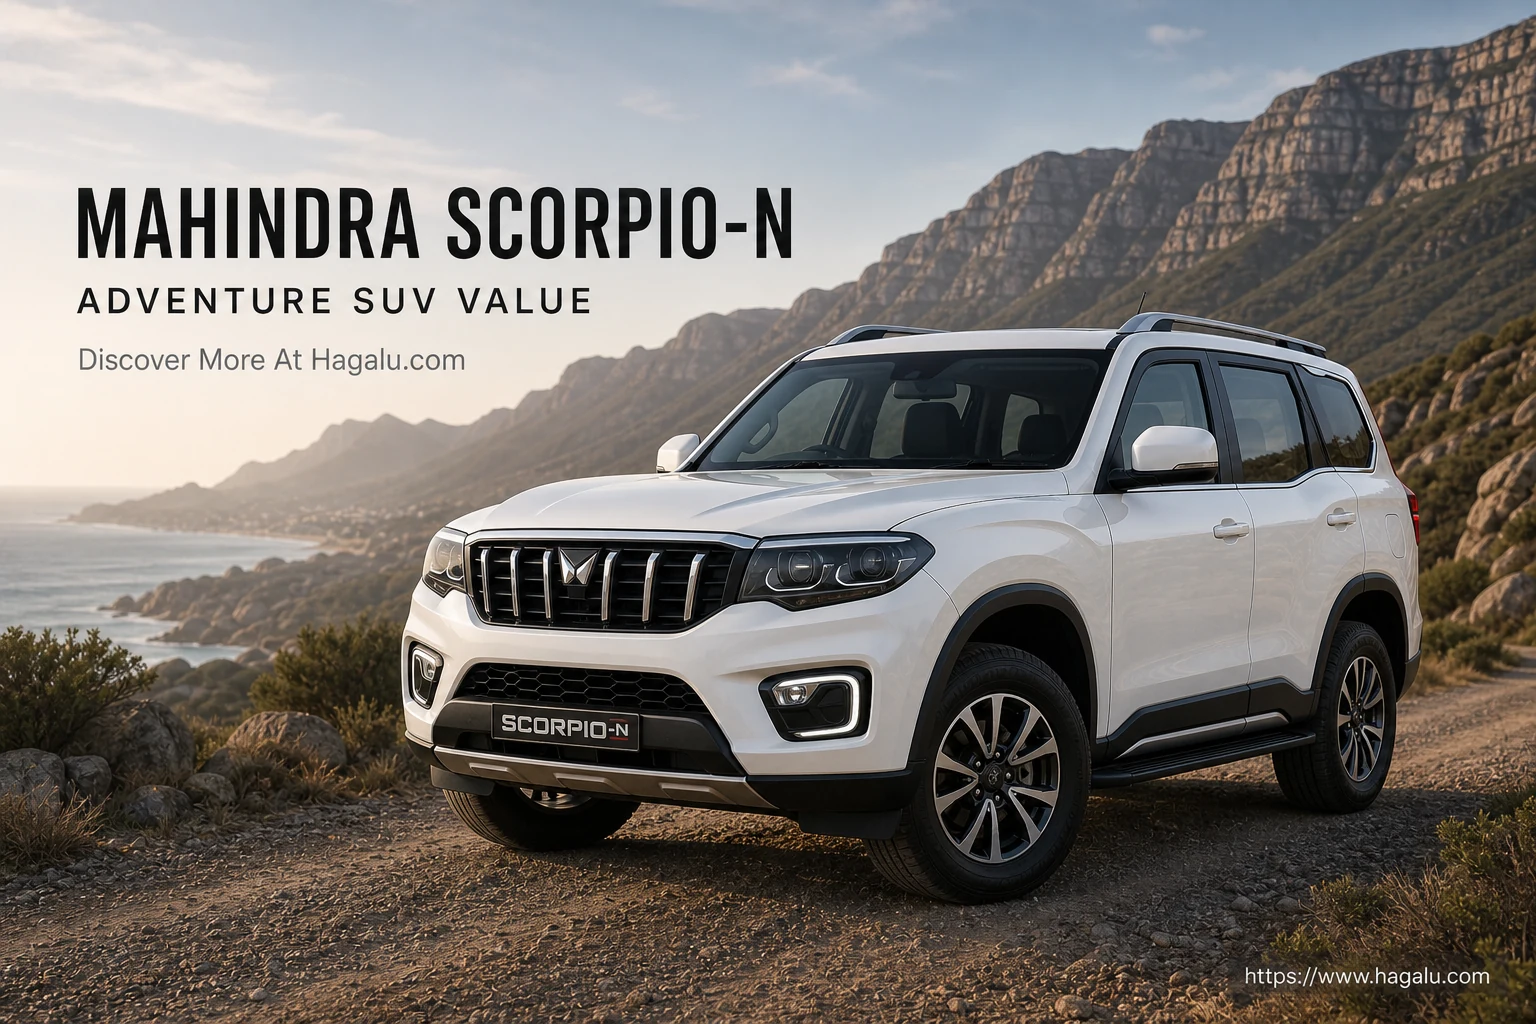
Scorpio-N
P Series vs Scorpio-N
→
V23
VS
T60 Double Cab
V23 vs T60 Double Cab
→
V23
VS
S6 Mining
V23 vs S6 Mining
→
P Series vs V23 questions
There is no universal winner. Use the comparison table to match the models and available derivatives in South Africa on price, safety equipment, space, powertrain and ownership cover. The category indicators summarise published catalogue data; they are not a road test or customer rating.
Compare the published consumption or mileage rows for the exact derivatives using the same unit and test basis. A catalogue figure is useful for like-for-like comparison, but traffic, speed, load, weather and driving style can change actual fuel use.
Compare only equipment explicitly listed for each derivative, including airbags, stability control and driver-assistance systems. Confirm the exact trim with the manufacturer, and treat any independent crash-test result separately because equipment and ratings can differ by market.
A reliable five-year total cannot be calculated from catalogue data alone. Add the exact purchase and finance cost, fuel or electricity, insurance quotes, scheduled servicing, tyres and expected resale value. Check whether the selected derivative includes a service or maintenance plan.
Use the seating, boot or load-space, ISOFIX and safety rows as a first check. Then test the exact cars with your child seats, passengers and typical luggage, because published dimensions do not show every access or comfort difference.
Compare the published power, torque and 0–100 km/h rows when they are available for both exact derivatives. Vehicle weight, gearing and power delivery also matter, so catalogue outputs alone do not establish real-world overtaking or response.