Home
›
South Africa
›
Compare
›
T2 vs Xpander
A proper head-to-head in South Africa — compare price, performance,
fuel economy or electric range, safety and the details that shape long-term ownership.
Odyssey 2.0TD+7DCT 4WD
Petrol
7-Speed DCT
Current
ZAR 679,900
ex-showroom
⚡ 180 kW
🔧 375 Nm
⛽ 10.8 km/l
BAIC B30
BAIC B40 Plus
BAIC X55 Plus
BMW 1 Series
BMW 2 Series Coupé
BMW 2 Series Gran Coupé
BMW 3 Series
BMW 4 Series Convertible
BMW 4 Series Coupé
BMW 4 Series Gran Coupé
BMW 5 Series
BMW 7 Series
BMW i4
BMW i5
BMW i7
BMW iX
BMW iX1
BMW iX2
BMW M2 Coupé
BMW M3 Sedan
BMW M3 Touring
BMW M4 Convertible
BMW M4 Coupé
BMW M5 Sedan
BMW M5 Touring
BMW X1
BMW X2
BMW X3
BMW X4
BMW X5
BMW X5 M
BMW X6
BMW X6 M
BMW X7
BMW XM
BYD ATTO 2 DM-i
BYD ATTO 3
BYD ATTO 8
BYD DOLPHIN
BYD DOLPHIN SURF
BYD SEAL
BYD SEALION 5 DM-i
BYD SEALION 6 DM-i
BYD SEALION 7
BYD SHARK 6 DMO
Changan Alsvin
Changan CS75 Pro
Changan Deepal S07
Changan Hunter Diesel
Changan Hunter K50 REEV
Changan UNI-S
Chery Tiggo 4 Cross
Chery Tiggo 4 Cross HEV
Chery Tiggo 4 Pro
Chery Tiggo 4 Pro Panel Van
Chery Tiggo 7
Chery Tiggo 7 PHEV
Chery Tiggo 7 Pro
Chery Tiggo 8 PHEV
Chery Tiggo 8 Pro
Chery Tiggo 8 Pro Max
Chery Tiggo 9
Chery Tiggo 9 PHEV
Dongfeng 007
Dongfeng 06
Dongfeng BOX
Dongfeng FRIDAY REEV
Ford Everest
Ford Mustang
Ford Ranger Platinum
Ford Ranger Raptor
Ford Ranger Sport
Ford Ranger Tremor
Ford Ranger Wildtrak
Ford Ranger XL
Ford Ranger XLT
Ford Territory
Ford Tourneo Custom
Ford Transit Custom
Ford Transit Van
Foton Asambe Taxi
Foton eAumark
Foton eTruckmate
Foton eView Panel Van
Foton Miler
Foton Miler Lite
Foton Truckmate
Foton Tunland G7 Double Cab
Foton Tunland G7 Single Cab
Foton Tunland V7 Double Cab
Foton Tunland V9 Double Cab
Foton View Luxury Shuttlebus
Foton View Panel Van
Geely Coolray
Geely E2
Geely E5 Electric
Geely E5 EM-i
GWM H6
GWM H6 GT
GWM H6 GT PHEV
GWM H6 PHEV
GWM H7
GWM Jolion
GWM Jolion Pro
GWM Jolion Pro Limited
GWM Ora 03
GWM ORA 5
GWM P300
GWM P500
GWM Tank 300
GWM Tank 500
Honda Amaze
Honda Civic RS
Honda Civic Type R
Honda CR-V
Honda Elevate
Honda Fit
Honda HR-V
Hyundai ALCAZAR
Hyundai EX-8 Chassis Cab
Hyundai EX-8 Dropside
Hyundai EX-8 Tipper
Hyundai EX-8 Van Body
Hyundai EXTER
Hyundai Grand i10
Hyundai Grand i10 Cargo
Hyundai Grand i10 Sedan
Hyundai H-100 Chassis Cab
Hyundai H-100 Deck
Hyundai H-100 Tipper
Hyundai i20
Hyundai Santa Fe Hybrid
Hyundai Staria
Hyundai Staria Panelvan
Hyundai Tucson
Hyundai Venue Cargo
iCAUR 03T
iCAUR V23
Isuzu D-Max Arctic Trucks AT35
Isuzu D-Max Double Cab
Isuzu D-Max Extended Cab
Isuzu D-Max Single Cab
Isuzu D-Max X-Rider
Isuzu MU-X
JAC T6 Single Cab
JAC T8 Double Cab
JAC T9 Double Cab
JAC X200 Double Cab
JAC X200 EV
JAC X200 Single Cab
Jaecoo J5
Jaecoo J7
Jaecoo J7 SHS
Jetour Dashing
Jetour T1
Jetour T1 i-DM
Jetour T2
Jetour T2 i-DM
Jetour X70 Plus
KIA Carens
KIA Carnival
KIA K2500
KIA K2700
KIA Pegas
KIA Picanto
KIA Picanto Panel Van
KIA Seltos
KIA Sonet
KIA Sonet Panel Van
KIA Sorento
KIA Sportage
KIA Tasman
LDV D90
LDV Deliver 9
LDV G10+ Van
LDV T60 Double Cab
LDV T60 Utility Single Cab
LDV Terron 9
Leapmotor C10 REEV
LEPAS L4
Lexus ES
Lexus GX
Lexus LX
Lexus NX
Lexus RX
Lexus RZ
Lexus UX
Mahindra Bolero
Mahindra Bolero MaXX Pik-Up
Mahindra Karoo Special Edition Dawn
Mahindra Karoo Special Edition Dew
Mahindra Karoo Special Edition Dusk
Mahindra Karoo Special Edition Storm
Mahindra Pik Up Double Cab
Mahindra Pik Up Single Cab
Mahindra S4 Game Viewer
Mahindra S4 Refrigeration
Mahindra S6 Ambulance
Mahindra S6 Mining
Mahindra Scorpio-N
Mahindra XUV3XO
Mahindra XUV 3XO Xprez Panel Van
Mahindra XUV700
Mazda CX-3
Mazda CX-30
Mazda CX-5
Mazda CX-60
Mazda Mazda2
Mazda Mazda3
Mercedes-Benz A-Class
Mercedes-Benz AMG GT 4-Door Coupé
Mercedes-Benz AMG GT Coupé
Mercedes-Benz B-Class
Mercedes-Benz C-Class
Mercedes-Benz CLA Coupé
Mercedes-Benz CLE Cabriolet
Mercedes-Benz CLE Coupé
Mercedes-Benz E-Class
Mercedes-Benz EQA
Mercedes-Benz EQB
Mercedes-Benz EQE Sedan
Mercedes-Benz EQE SUV
Mercedes-Benz EQS Sedan
Mercedes-Benz EQS SUV
Mercedes-Benz EQV
Mercedes-Benz G 580 with EQ Technology
Mercedes-Benz G-Class
Mercedes-Benz GLA
Mercedes-Benz GLB
Mercedes-Benz GLC
Mercedes-Benz GLC Coupé
Mercedes-Benz GLE
Mercedes-Benz GLE Coupé
Mercedes-Benz GLS
Mercedes-Benz Mercedes-Maybach GLS
Mercedes-Benz Mercedes-Maybach S-Class
Mercedes-Benz Mercedes-Maybach SL
Mercedes-Benz S-Class
Mercedes-Benz SL Roadster
Mercedes-Benz V-Class
MG Cyberster
MG HS
MG MG3
MG ZS
MG ZS Pro
Mitsubishi Destinator
Mitsubishi Eclipse Cross
Mitsubishi Outlander
Mitsubishi Outlander Sport
Mitsubishi Pajero Sport
Mitsubishi Triton Double Cab
Mitsubishi Triton Single Cab
Mitsubishi Xpander
Nissan Magnite
Nissan Navara Double Cab
Nissan Navara Single Cab
Nissan X-Trail
Omoda C5
Omoda C5 SHS
Omoda C5-X
Omoda C7
Omoda C9
Omoda C9 SHS
Renault Captur
Renault Duster
Renault Kiger
Renault Kwid
Renault Kwid Limited Edition
Renault Trafic Panel Van
Renault Trafic Passenger
Renault Triber
Renault Triber Express
Renault Triber Express III
RIDDARA RD6
Rolls-Royce Black Badge Cullinan
Rolls-Royce Black Badge Ghost
Rolls-Royce Black Badge Spectre Series II
Rolls-Royce Cullinan
Rolls-Royce Ghost
Rolls-Royce Ghost Extended
Rolls-Royce Phantom
Rolls-Royce Phantom Extended
Rolls-Royce Spectre Series II
Suzuki Across
Suzuki Baleno
Suzuki Celerio
Suzuki Dzire
Suzuki Eeco
Suzuki Ertiga
Suzuki Fronx
Suzuki Grand Vitara
Suzuki Ignis
Suzuki Jimny
Suzuki Jimny 5-Door
Suzuki S-Presso
Suzuki Super Carry
Suzuki Swift
Suzuki Swift Sport
Suzuki XL6
Tata Curvv
Tata Harrier
Tata Punch
Tata Tiago
Toyota bZ4X
Toyota Coaster
Toyota Corolla
Toyota Corolla Cross
Toyota Corolla Hatch
Toyota Fortuner
Toyota GR86
Toyota GR Corolla
Toyota GR Supra
Toyota GR Yaris
Toyota Hiace
Toyota Hiace Ses'fikile
Toyota Hilux Double Cab
Toyota Hilux Single Cab
Toyota Hilux Xtra Cab
Toyota Land Cruiser 300
Toyota Land Cruiser 76
Toyota Land Cruiser 79 Double Cab
Toyota Land Cruiser 79 Single Cab
Toyota Land Cruiser FJ
Toyota Land Cruiser Prado
Toyota Quantum Bus
Toyota Quantum Panel Van
Toyota RAV4
Toyota Rumion
Toyota Starlet
Toyota Starlet Cross
Toyota Urban Cruiser
Toyota Vitz
Volkswagen Amarok
Volkswagen Caddy
Volkswagen Caddy Cargo
Volkswagen Crafter
Volkswagen Golf 1.4 TSI
Volkswagen Golf GTI
Volkswagen Polo
Volkswagen Polo Sedan
Volkswagen Polo-Vivo
Volkswagen Taigo
Volkswagen Tayron
Volkswagen T-Cross
Volkswagen Tiguan
Volkswagen Touareg
Volkswagen Transporter Kombi
Volkswagen Transporter Vans
Volkswagen T-Roc
Volkswagen Vivo Xpress
BAIC B70 / City Hunter (upcoming)
BAIC B81 (upcoming)
BMW iX3 (upcoming)
BMW X5 (G65) (upcoming)
Changan Deepal S05 REEV (upcoming)
Chery Chery Q (upcoming)
Chery KP31 (upcoming)
Chery Tiggo V (upcoming)
DENZA B5 (upcoming)
DENZA B8 (upcoming)
DENZA D9 (upcoming)
DENZA N9 (upcoming)
Ford Ranger Super Duty (upcoming)
Hyundai All-new GT-11 Mighty (upcoming)
Hyundai New CRETA (upcoming)
iCAUR V27 (upcoming)
JAC JS9 (upcoming)
JAC T9 PHEV (upcoming)
Jaecoo J5 EV (upcoming)
Jaecoo J5 SHS (upcoming)
LDV G90 (upcoming)
Leapmotor B03X (upcoming)
Leapmotor B05 (upcoming)
Leapmotor B10 (upcoming)
LEPAS L6 (upcoming)
LEPAS L8 (upcoming)
Lexus All-New ES (upcoming)
Mazda All-New CX-5 (upcoming)
Mercedes-Benz AMG GT 4-Door Electric (upcoming)
Mercedes-Benz C-Class Electric (upcoming)
Mercedes-Benz CLA Electric (upcoming)
Mercedes-Benz CLA Hybrid (upcoming)
Mercedes-Benz GLB Electric (upcoming)
Mercedes-Benz GLC Electric (upcoming)
Mercedes-Benz S-Class facelift (upcoming)
MG HS PHEV (upcoming)
Nissan New Patrol (upcoming)
Nissan Tekton (upcoming)
Omoda C4 (upcoming)
Tata Osprey (upcoming)
Tata Sierra (upcoming)
Toyota Hilux Single Cab New Generation (upcoming)
Volkswagen T7 Multivan Caravelle (upcoming)
Volkswagen T-Roc Second Generation (upcoming)
ZEEKR 001 (upcoming)
ZEEKR 009 (upcoming)
ZEEKR 7X (upcoming)
ZEEKR X (upcoming)
Ford EcoSport (archived)
Ford Puma (archived)
Ford Ranger (archived)
GWM Cannon (archived)
GWM Cannon Alpha (archived)
GWM H1 (archived)
GWM H2 (archived)
GWM Jolion GT (archived)
GWM Ora Good Cat (archived)
GWM P Series (archived)
GWM Steed 5 (archived)
GWM Steed 6 (archived)
Hyundai Creta (archived)
Hyundai Elantra (archived)
Hyundai H1 (archived)
Hyundai i30 (archived)
Hyundai IONIQ 5 (archived)
Hyundai IONIQ 6 (archived)
Hyundai Kona (archived)
Hyundai Palisade (archived)
Hyundai Santa Fe (archived)
Hyundai Venue (archived)
Isuzu D-Max (archived)
Mahindra KUV100 (archived)
Mahindra XUV300 (archived)
Mahindra XUV500 (archived)
Nissan Navara (archived)
Nissan NP200 (archived)
Nissan NP300 Hardbody (archived)
Nissan Patrol (archived)
Nissan Qashqai (archived)
Rolls-Royce Black Badge Wraith (archived)
Rolls-Royce Dawn (archived)
Rolls-Royce Phantom Coupé (archived)
Rolls-Royce Phantom Drophead Coupé (archived)
Rolls-Royce Spectre (archived)
Rolls-Royce Wraith (archived)
Toyota Agya (archived)
Toyota Camry (archived)
Toyota C-HR (archived)
Toyota Corolla Sedan (archived)
Toyota Hilux (archived)
Toyota Hilux Custom Builds (archived)
Toyota Land Cruiser 79 (archived)
Toyota Quantum (archived)
Toyota Yaris (archived)
Volkswagen Golf (archived)
Volkswagen Tiguan Allspace (archived)
VS
Cross 1.5 A/T
Petrol
4-Speed Automatic
Current
ZAR 419,995
ex-showroom
⚡ 77 kW
🔧 141 Nm
⛽ 14.3 km/l
BAIC B30
BAIC B40 Plus
BAIC X55 Plus
BMW 1 Series
BMW 2 Series Coupé
BMW 2 Series Gran Coupé
BMW 3 Series
BMW 4 Series Convertible
BMW 4 Series Coupé
BMW 4 Series Gran Coupé
BMW 5 Series
BMW 7 Series
BMW i4
BMW i5
BMW i7
BMW iX
BMW iX1
BMW iX2
BMW M2 Coupé
BMW M3 Sedan
BMW M3 Touring
BMW M4 Convertible
BMW M4 Coupé
BMW M5 Sedan
BMW M5 Touring
BMW X1
BMW X2
BMW X3
BMW X4
BMW X5
BMW X5 M
BMW X6
BMW X6 M
BMW X7
BMW XM
BYD ATTO 2 DM-i
BYD ATTO 3
BYD ATTO 8
BYD DOLPHIN
BYD DOLPHIN SURF
BYD SEAL
BYD SEALION 5 DM-i
BYD SEALION 6 DM-i
BYD SEALION 7
BYD SHARK 6 DMO
Changan Alsvin
Changan CS75 Pro
Changan Deepal S07
Changan Hunter Diesel
Changan Hunter K50 REEV
Changan UNI-S
Chery Tiggo 4 Cross
Chery Tiggo 4 Cross HEV
Chery Tiggo 4 Pro
Chery Tiggo 4 Pro Panel Van
Chery Tiggo 7
Chery Tiggo 7 PHEV
Chery Tiggo 7 Pro
Chery Tiggo 8 PHEV
Chery Tiggo 8 Pro
Chery Tiggo 8 Pro Max
Chery Tiggo 9
Chery Tiggo 9 PHEV
Dongfeng 007
Dongfeng 06
Dongfeng BOX
Dongfeng FRIDAY REEV
Ford Everest
Ford Mustang
Ford Ranger Platinum
Ford Ranger Raptor
Ford Ranger Sport
Ford Ranger Tremor
Ford Ranger Wildtrak
Ford Ranger XL
Ford Ranger XLT
Ford Territory
Ford Tourneo Custom
Ford Transit Custom
Ford Transit Van
Foton Asambe Taxi
Foton eAumark
Foton eTruckmate
Foton eView Panel Van
Foton Miler
Foton Miler Lite
Foton Truckmate
Foton Tunland G7 Double Cab
Foton Tunland G7 Single Cab
Foton Tunland V7 Double Cab
Foton Tunland V9 Double Cab
Foton View Luxury Shuttlebus
Foton View Panel Van
Geely Coolray
Geely E2
Geely E5 Electric
Geely E5 EM-i
GWM H6
GWM H6 GT
GWM H6 GT PHEV
GWM H6 PHEV
GWM H7
GWM Jolion
GWM Jolion Pro
GWM Jolion Pro Limited
GWM Ora 03
GWM ORA 5
GWM P300
GWM P500
GWM Tank 300
GWM Tank 500
Honda Amaze
Honda Civic RS
Honda Civic Type R
Honda CR-V
Honda Elevate
Honda Fit
Honda HR-V
Hyundai ALCAZAR
Hyundai EX-8 Chassis Cab
Hyundai EX-8 Dropside
Hyundai EX-8 Tipper
Hyundai EX-8 Van Body
Hyundai EXTER
Hyundai Grand i10
Hyundai Grand i10 Cargo
Hyundai Grand i10 Sedan
Hyundai H-100 Chassis Cab
Hyundai H-100 Deck
Hyundai H-100 Tipper
Hyundai i20
Hyundai Santa Fe Hybrid
Hyundai Staria
Hyundai Staria Panelvan
Hyundai Tucson
Hyundai Venue Cargo
iCAUR 03T
iCAUR V23
Isuzu D-Max Arctic Trucks AT35
Isuzu D-Max Double Cab
Isuzu D-Max Extended Cab
Isuzu D-Max Single Cab
Isuzu D-Max X-Rider
Isuzu MU-X
JAC T6 Single Cab
JAC T8 Double Cab
JAC T9 Double Cab
JAC X200 Double Cab
JAC X200 EV
JAC X200 Single Cab
Jaecoo J5
Jaecoo J7
Jaecoo J7 SHS
Jetour Dashing
Jetour T1
Jetour T1 i-DM
Jetour T2
Jetour T2 i-DM
Jetour X70 Plus
KIA Carens
KIA Carnival
KIA K2500
KIA K2700
KIA Pegas
KIA Picanto
KIA Picanto Panel Van
KIA Seltos
KIA Sonet
KIA Sonet Panel Van
KIA Sorento
KIA Sportage
KIA Tasman
LDV D90
LDV Deliver 9
LDV G10+ Van
LDV T60 Double Cab
LDV T60 Utility Single Cab
LDV Terron 9
Leapmotor C10 REEV
LEPAS L4
Lexus ES
Lexus GX
Lexus LX
Lexus NX
Lexus RX
Lexus RZ
Lexus UX
Mahindra Bolero
Mahindra Bolero MaXX Pik-Up
Mahindra Karoo Special Edition Dawn
Mahindra Karoo Special Edition Dew
Mahindra Karoo Special Edition Dusk
Mahindra Karoo Special Edition Storm
Mahindra Pik Up Double Cab
Mahindra Pik Up Single Cab
Mahindra S4 Game Viewer
Mahindra S4 Refrigeration
Mahindra S6 Ambulance
Mahindra S6 Mining
Mahindra Scorpio-N
Mahindra XUV3XO
Mahindra XUV 3XO Xprez Panel Van
Mahindra XUV700
Mazda CX-3
Mazda CX-30
Mazda CX-5
Mazda CX-60
Mazda Mazda2
Mazda Mazda3
Mercedes-Benz A-Class
Mercedes-Benz AMG GT 4-Door Coupé
Mercedes-Benz AMG GT Coupé
Mercedes-Benz B-Class
Mercedes-Benz C-Class
Mercedes-Benz CLA Coupé
Mercedes-Benz CLE Cabriolet
Mercedes-Benz CLE Coupé
Mercedes-Benz E-Class
Mercedes-Benz EQA
Mercedes-Benz EQB
Mercedes-Benz EQE Sedan
Mercedes-Benz EQE SUV
Mercedes-Benz EQS Sedan
Mercedes-Benz EQS SUV
Mercedes-Benz EQV
Mercedes-Benz G 580 with EQ Technology
Mercedes-Benz G-Class
Mercedes-Benz GLA
Mercedes-Benz GLB
Mercedes-Benz GLC
Mercedes-Benz GLC Coupé
Mercedes-Benz GLE
Mercedes-Benz GLE Coupé
Mercedes-Benz GLS
Mercedes-Benz Mercedes-Maybach GLS
Mercedes-Benz Mercedes-Maybach S-Class
Mercedes-Benz Mercedes-Maybach SL
Mercedes-Benz S-Class
Mercedes-Benz SL Roadster
Mercedes-Benz V-Class
MG Cyberster
MG HS
MG MG3
MG ZS
MG ZS Pro
Mitsubishi Destinator
Mitsubishi Eclipse Cross
Mitsubishi Outlander
Mitsubishi Outlander Sport
Mitsubishi Pajero Sport
Mitsubishi Triton Double Cab
Mitsubishi Triton Single Cab
Mitsubishi Xpander
Nissan Magnite
Nissan Navara Double Cab
Nissan Navara Single Cab
Nissan X-Trail
Omoda C5
Omoda C5 SHS
Omoda C5-X
Omoda C7
Omoda C9
Omoda C9 SHS
Renault Captur
Renault Duster
Renault Kiger
Renault Kwid
Renault Kwid Limited Edition
Renault Trafic Panel Van
Renault Trafic Passenger
Renault Triber
Renault Triber Express
Renault Triber Express III
RIDDARA RD6
Rolls-Royce Black Badge Cullinan
Rolls-Royce Black Badge Ghost
Rolls-Royce Black Badge Spectre Series II
Rolls-Royce Cullinan
Rolls-Royce Ghost
Rolls-Royce Ghost Extended
Rolls-Royce Phantom
Rolls-Royce Phantom Extended
Rolls-Royce Spectre Series II
Suzuki Across
Suzuki Baleno
Suzuki Celerio
Suzuki Dzire
Suzuki Eeco
Suzuki Ertiga
Suzuki Fronx
Suzuki Grand Vitara
Suzuki Ignis
Suzuki Jimny
Suzuki Jimny 5-Door
Suzuki S-Presso
Suzuki Super Carry
Suzuki Swift
Suzuki Swift Sport
Suzuki XL6
Tata Curvv
Tata Harrier
Tata Punch
Tata Tiago
Toyota bZ4X
Toyota Coaster
Toyota Corolla
Toyota Corolla Cross
Toyota Corolla Hatch
Toyota Fortuner
Toyota GR86
Toyota GR Corolla
Toyota GR Supra
Toyota GR Yaris
Toyota Hiace
Toyota Hiace Ses'fikile
Toyota Hilux Double Cab
Toyota Hilux Single Cab
Toyota Hilux Xtra Cab
Toyota Land Cruiser 300
Toyota Land Cruiser 76
Toyota Land Cruiser 79 Double Cab
Toyota Land Cruiser 79 Single Cab
Toyota Land Cruiser FJ
Toyota Land Cruiser Prado
Toyota Quantum Bus
Toyota Quantum Panel Van
Toyota RAV4
Toyota Rumion
Toyota Starlet
Toyota Starlet Cross
Toyota Urban Cruiser
Toyota Vitz
Volkswagen Amarok
Volkswagen Caddy
Volkswagen Caddy Cargo
Volkswagen Crafter
Volkswagen Golf 1.4 TSI
Volkswagen Golf GTI
Volkswagen Polo
Volkswagen Polo Sedan
Volkswagen Polo-Vivo
Volkswagen Taigo
Volkswagen Tayron
Volkswagen T-Cross
Volkswagen Tiguan
Volkswagen Touareg
Volkswagen Transporter Kombi
Volkswagen Transporter Vans
Volkswagen T-Roc
Volkswagen Vivo Xpress
BAIC B70 / City Hunter (upcoming)
BAIC B81 (upcoming)
BMW iX3 (upcoming)
BMW X5 (G65) (upcoming)
Changan Deepal S05 REEV (upcoming)
Chery Chery Q (upcoming)
Chery KP31 (upcoming)
Chery Tiggo V (upcoming)
DENZA B5 (upcoming)
DENZA B8 (upcoming)
DENZA D9 (upcoming)
DENZA N9 (upcoming)
Ford Ranger Super Duty (upcoming)
Hyundai All-new GT-11 Mighty (upcoming)
Hyundai New CRETA (upcoming)
iCAUR V27 (upcoming)
JAC JS9 (upcoming)
JAC T9 PHEV (upcoming)
Jaecoo J5 EV (upcoming)
Jaecoo J5 SHS (upcoming)
LDV G90 (upcoming)
Leapmotor B03X (upcoming)
Leapmotor B05 (upcoming)
Leapmotor B10 (upcoming)
LEPAS L6 (upcoming)
LEPAS L8 (upcoming)
Lexus All-New ES (upcoming)
Mazda All-New CX-5 (upcoming)
Mercedes-Benz AMG GT 4-Door Electric (upcoming)
Mercedes-Benz C-Class Electric (upcoming)
Mercedes-Benz CLA Electric (upcoming)
Mercedes-Benz CLA Hybrid (upcoming)
Mercedes-Benz GLB Electric (upcoming)
Mercedes-Benz GLC Electric (upcoming)
Mercedes-Benz S-Class facelift (upcoming)
MG HS PHEV (upcoming)
Nissan New Patrol (upcoming)
Nissan Tekton (upcoming)
Omoda C4 (upcoming)
Tata Osprey (upcoming)
Tata Sierra (upcoming)
Toyota Hilux Single Cab New Generation (upcoming)
Volkswagen T7 Multivan Caravelle (upcoming)
Volkswagen T-Roc Second Generation (upcoming)
ZEEKR 001 (upcoming)
ZEEKR 009 (upcoming)
ZEEKR 7X (upcoming)
ZEEKR X (upcoming)
Ford EcoSport (archived)
Ford Puma (archived)
Ford Ranger (archived)
GWM Cannon (archived)
GWM Cannon Alpha (archived)
GWM H1 (archived)
GWM H2 (archived)
GWM Jolion GT (archived)
GWM Ora Good Cat (archived)
GWM P Series (archived)
GWM Steed 5 (archived)
GWM Steed 6 (archived)
Hyundai Creta (archived)
Hyundai Elantra (archived)
Hyundai H1 (archived)
Hyundai i30 (archived)
Hyundai IONIQ 5 (archived)
Hyundai IONIQ 6 (archived)
Hyundai Kona (archived)
Hyundai Palisade (archived)
Hyundai Santa Fe (archived)
Hyundai Venue (archived)
Isuzu D-Max (archived)
Mahindra KUV100 (archived)
Mahindra XUV300 (archived)
Mahindra XUV500 (archived)
Nissan Navara (archived)
Nissan NP200 (archived)
Nissan NP300 Hardbody (archived)
Nissan Patrol (archived)
Nissan Qashqai (archived)
Rolls-Royce Black Badge Wraith (archived)
Rolls-Royce Dawn (archived)
Rolls-Royce Phantom Coupé (archived)
Rolls-Royce Phantom Drophead Coupé (archived)
Rolls-Royce Spectre (archived)
Rolls-Royce Wraith (archived)
Toyota Agya (archived)
Toyota Camry (archived)
Toyota C-HR (archived)
Toyota Corolla Sedan (archived)
Toyota Hilux (archived)
Toyota Hilux Custom Builds (archived)
Toyota Land Cruiser 79 (archived)
Toyota Quantum (archived)
Toyota Yaris (archived)
Volkswagen Golf (archived)
Volkswagen Tiguan Allspace (archived)
+
Add a 3rd car
Select a car to compare…
BAIC B30
BAIC B40 Plus
BAIC X55 Plus
BMW 1 Series
BMW 2 Series Coupé
BMW 2 Series Gran Coupé
BMW 3 Series
BMW 4 Series Convertible
BMW 4 Series Coupé
BMW 4 Series Gran Coupé
BMW 5 Series
BMW 7 Series
BMW i4
BMW i5
BMW i7
BMW iX
BMW iX1
BMW iX2
BMW M2 Coupé
BMW M3 Sedan
BMW M3 Touring
BMW M4 Convertible
BMW M4 Coupé
BMW M5 Sedan
BMW M5 Touring
BMW X1
BMW X2
BMW X3
BMW X4
BMW X5
BMW X5 M
BMW X6
BMW X6 M
BMW X7
BMW XM
BYD ATTO 2 DM-i
BYD ATTO 3
BYD ATTO 8
BYD DOLPHIN
BYD DOLPHIN SURF
BYD SEAL
BYD SEALION 5 DM-i
BYD SEALION 6 DM-i
BYD SEALION 7
BYD SHARK 6 DMO
Changan Alsvin
Changan CS75 Pro
Changan Deepal S07
Changan Hunter Diesel
Changan Hunter K50 REEV
Changan UNI-S
Chery Tiggo 4 Cross
Chery Tiggo 4 Cross HEV
Chery Tiggo 4 Pro
Chery Tiggo 4 Pro Panel Van
Chery Tiggo 7
Chery Tiggo 7 PHEV
Chery Tiggo 7 Pro
Chery Tiggo 8 PHEV
Chery Tiggo 8 Pro
Chery Tiggo 8 Pro Max
Chery Tiggo 9
Chery Tiggo 9 PHEV
Dongfeng 007
Dongfeng 06
Dongfeng BOX
Dongfeng FRIDAY REEV
Ford Everest
Ford Mustang
Ford Ranger Platinum
Ford Ranger Raptor
Ford Ranger Sport
Ford Ranger Tremor
Ford Ranger Wildtrak
Ford Ranger XL
Ford Ranger XLT
Ford Territory
Ford Tourneo Custom
Ford Transit Custom
Ford Transit Van
Foton Asambe Taxi
Foton eAumark
Foton eTruckmate
Foton eView Panel Van
Foton Miler
Foton Miler Lite
Foton Truckmate
Foton Tunland G7 Double Cab
Foton Tunland G7 Single Cab
Foton Tunland V7 Double Cab
Foton Tunland V9 Double Cab
Foton View Luxury Shuttlebus
Foton View Panel Van
Geely Coolray
Geely E2
Geely E5 Electric
Geely E5 EM-i
GWM H6
GWM H6 GT
GWM H6 GT PHEV
GWM H6 PHEV
GWM H7
GWM Jolion
GWM Jolion Pro
GWM Jolion Pro Limited
GWM Ora 03
GWM ORA 5
GWM P300
GWM P500
GWM Tank 300
GWM Tank 500
Honda Amaze
Honda Civic RS
Honda Civic Type R
Honda CR-V
Honda Elevate
Honda Fit
Honda HR-V
Hyundai ALCAZAR
Hyundai EX-8 Chassis Cab
Hyundai EX-8 Dropside
Hyundai EX-8 Tipper
Hyundai EX-8 Van Body
Hyundai EXTER
Hyundai Grand i10
Hyundai Grand i10 Cargo
Hyundai Grand i10 Sedan
Hyundai H-100 Chassis Cab
Hyundai H-100 Deck
Hyundai H-100 Tipper
Hyundai i20
Hyundai Santa Fe Hybrid
Hyundai Staria
Hyundai Staria Panelvan
Hyundai Tucson
Hyundai Venue Cargo
iCAUR 03T
iCAUR V23
Isuzu D-Max Arctic Trucks AT35
Isuzu D-Max Double Cab
Isuzu D-Max Extended Cab
Isuzu D-Max Single Cab
Isuzu D-Max X-Rider
Isuzu MU-X
JAC T6 Single Cab
JAC T8 Double Cab
JAC T9 Double Cab
JAC X200 Double Cab
JAC X200 EV
JAC X200 Single Cab
Jaecoo J5
Jaecoo J7
Jaecoo J7 SHS
Jetour Dashing
Jetour T1
Jetour T1 i-DM
Jetour T2
Jetour T2 i-DM
Jetour X70 Plus
KIA Carens
KIA Carnival
KIA K2500
KIA K2700
KIA Pegas
KIA Picanto
KIA Picanto Panel Van
KIA Seltos
KIA Sonet
KIA Sonet Panel Van
KIA Sorento
KIA Sportage
KIA Tasman
LDV D90
LDV Deliver 9
LDV G10+ Van
LDV T60 Double Cab
LDV T60 Utility Single Cab
LDV Terron 9
Leapmotor C10 REEV
LEPAS L4
Lexus ES
Lexus GX
Lexus LX
Lexus NX
Lexus RX
Lexus RZ
Lexus UX
Mahindra Bolero
Mahindra Bolero MaXX Pik-Up
Mahindra Karoo Special Edition Dawn
Mahindra Karoo Special Edition Dew
Mahindra Karoo Special Edition Dusk
Mahindra Karoo Special Edition Storm
Mahindra Pik Up Double Cab
Mahindra Pik Up Single Cab
Mahindra S4 Game Viewer
Mahindra S4 Refrigeration
Mahindra S6 Ambulance
Mahindra S6 Mining
Mahindra Scorpio-N
Mahindra XUV3XO
Mahindra XUV 3XO Xprez Panel Van
Mahindra XUV700
Mazda CX-3
Mazda CX-30
Mazda CX-5
Mazda CX-60
Mazda Mazda2
Mazda Mazda3
Mercedes-Benz A-Class
Mercedes-Benz AMG GT 4-Door Coupé
Mercedes-Benz AMG GT Coupé
Mercedes-Benz B-Class
Mercedes-Benz C-Class
Mercedes-Benz CLA Coupé
Mercedes-Benz CLE Cabriolet
Mercedes-Benz CLE Coupé
Mercedes-Benz E-Class
Mercedes-Benz EQA
Mercedes-Benz EQB
Mercedes-Benz EQE Sedan
Mercedes-Benz EQE SUV
Mercedes-Benz EQS Sedan
Mercedes-Benz EQS SUV
Mercedes-Benz EQV
Mercedes-Benz G 580 with EQ Technology
Mercedes-Benz G-Class
Mercedes-Benz GLA
Mercedes-Benz GLB
Mercedes-Benz GLC
Mercedes-Benz GLC Coupé
Mercedes-Benz GLE
Mercedes-Benz GLE Coupé
Mercedes-Benz GLS
Mercedes-Benz Mercedes-Maybach GLS
Mercedes-Benz Mercedes-Maybach S-Class
Mercedes-Benz Mercedes-Maybach SL
Mercedes-Benz S-Class
Mercedes-Benz SL Roadster
Mercedes-Benz V-Class
MG Cyberster
MG HS
MG MG3
MG ZS
MG ZS Pro
Mitsubishi Destinator
Mitsubishi Eclipse Cross
Mitsubishi Outlander
Mitsubishi Outlander Sport
Mitsubishi Pajero Sport
Mitsubishi Triton Double Cab
Mitsubishi Triton Single Cab
Mitsubishi Xpander
Nissan Magnite
Nissan Navara Double Cab
Nissan Navara Single Cab
Nissan X-Trail
Omoda C5
Omoda C5 SHS
Omoda C5-X
Omoda C7
Omoda C9
Omoda C9 SHS
Renault Captur
Renault Duster
Renault Kiger
Renault Kwid
Renault Kwid Limited Edition
Renault Trafic Panel Van
Renault Trafic Passenger
Renault Triber
Renault Triber Express
Renault Triber Express III
RIDDARA RD6
Rolls-Royce Black Badge Cullinan
Rolls-Royce Black Badge Ghost
Rolls-Royce Black Badge Spectre Series II
Rolls-Royce Cullinan
Rolls-Royce Ghost
Rolls-Royce Ghost Extended
Rolls-Royce Phantom
Rolls-Royce Phantom Extended
Rolls-Royce Spectre Series II
Suzuki Across
Suzuki Baleno
Suzuki Celerio
Suzuki Dzire
Suzuki Eeco
Suzuki Ertiga
Suzuki Fronx
Suzuki Grand Vitara
Suzuki Ignis
Suzuki Jimny
Suzuki Jimny 5-Door
Suzuki S-Presso
Suzuki Super Carry
Suzuki Swift
Suzuki Swift Sport
Suzuki XL6
Tata Curvv
Tata Harrier
Tata Punch
Tata Tiago
Toyota bZ4X
Toyota Coaster
Toyota Corolla
Toyota Corolla Cross
Toyota Corolla Hatch
Toyota Fortuner
Toyota GR86
Toyota GR Corolla
Toyota GR Supra
Toyota GR Yaris
Toyota Hiace
Toyota Hiace Ses'fikile
Toyota Hilux Double Cab
Toyota Hilux Single Cab
Toyota Hilux Xtra Cab
Toyota Land Cruiser 300
Toyota Land Cruiser 76
Toyota Land Cruiser 79 Double Cab
Toyota Land Cruiser 79 Single Cab
Toyota Land Cruiser FJ
Toyota Land Cruiser Prado
Toyota Quantum Bus
Toyota Quantum Panel Van
Toyota RAV4
Toyota Rumion
Toyota Starlet
Toyota Starlet Cross
Toyota Urban Cruiser
Toyota Vitz
Volkswagen Amarok
Volkswagen Caddy
Volkswagen Caddy Cargo
Volkswagen Crafter
Volkswagen Golf 1.4 TSI
Volkswagen Golf GTI
Volkswagen Polo
Volkswagen Polo Sedan
Volkswagen Polo-Vivo
Volkswagen Taigo
Volkswagen Tayron
Volkswagen T-Cross
Volkswagen Tiguan
Volkswagen Touareg
Volkswagen Transporter Kombi
Volkswagen Transporter Vans
Volkswagen T-Roc
Volkswagen Vivo Xpress
BAIC B70 / City Hunter
BAIC B81
BMW iX3
BMW X5 (G65)
Changan Deepal S05 REEV
Chery Chery Q
Chery KP31
Chery Tiggo V
DENZA B5
DENZA B8
DENZA D9
DENZA N9
Ford Ranger Super Duty
Hyundai All-new GT-11 Mighty
Hyundai New CRETA
iCAUR V27
JAC JS9
JAC T9 PHEV
Jaecoo J5 EV
Jaecoo J5 SHS
LDV G90
Leapmotor B03X
Leapmotor B05
Leapmotor B10
LEPAS L6
LEPAS L8
Lexus All-New ES
Mazda All-New CX-5
Mercedes-Benz AMG GT 4-Door Electric
Mercedes-Benz C-Class Electric
Mercedes-Benz CLA Electric
Mercedes-Benz CLA Hybrid
Mercedes-Benz GLB Electric
Mercedes-Benz GLC Electric
Mercedes-Benz S-Class facelift
MG HS PHEV
Nissan New Patrol
Nissan Tekton
Omoda C4
Tata Osprey
Tata Sierra
Toyota Hilux Single Cab New Generation
Volkswagen T7 Multivan Caravelle
Volkswagen T-Roc Second Generation
ZEEKR 001
ZEEKR 009
ZEEKR 7X
ZEEKR X
Ford EcoSport (archived)
Ford Puma (archived)
Ford Ranger (archived)
GWM Cannon (archived)
GWM Cannon Alpha (archived)
GWM H1 (archived)
GWM H2 (archived)
GWM Jolion GT (archived)
GWM Ora Good Cat (archived)
GWM P Series (archived)
GWM Steed 5 (archived)
GWM Steed 6 (archived)
Hyundai Creta (archived)
Hyundai Elantra (archived)
Hyundai H1 (archived)
Hyundai i30 (archived)
Hyundai IONIQ 5 (archived)
Hyundai IONIQ 6 (archived)
Hyundai Kona (archived)
Hyundai Palisade (archived)
Hyundai Santa Fe (archived)
Hyundai Venue (archived)
Isuzu D-Max (archived)
Mahindra KUV100 (archived)
Mahindra XUV300 (archived)
Mahindra XUV500 (archived)
Nissan Navara (archived)
Nissan NP200 (archived)
Nissan NP300 Hardbody (archived)
Nissan Patrol (archived)
Nissan Qashqai (archived)
Rolls-Royce Black Badge Wraith (archived)
Rolls-Royce Dawn (archived)
Rolls-Royce Phantom Coupé (archived)
Rolls-Royce Phantom Drophead Coupé (archived)
Rolls-Royce Spectre (archived)
Rolls-Royce Wraith (archived)
Toyota Agya (archived)
Toyota Camry (archived)
Toyota C-HR (archived)
Toyota Corolla Sedan (archived)
Toyota Hilux (archived)
Toyota Hilux Custom Builds (archived)
Toyota Land Cruiser 79 (archived)
Toyota Quantum (archived)
Toyota Yaris (archived)
Volkswagen Golf (archived)
Volkswagen Tiguan Allspace (archived)
Add
Short answer
Editorial ratings
Images
All Specs
Spec index
Verdict
FAQs
Decision summary
Jetour T2 vs Mitsubishi Xpander: the short answer
T2 has a large lead in Hagalu's source-backed catalogue index over Xpander.
Xpander starts ZAR 203,905 cheaper
T2 from ZAR 569,900 · Xpander from ZAR 365,995
Five key differences
Exact selected derivatives
Swipe sideways to compare every column
Independent editorial assessment
Hagalu editorial ratings
When a variant is selected, its rating out of five applies only to that exact derivative; a model-range review is not inherited. Editorial ratings are separate from the Specification Evidence Index out of 100 and are not customer ratings.
Jetour T2
Odyssey 2.0TD+7DCT 4WD
Hagalu editorial rating
Not yet rated
No complete editorial rating is published for this exact variant. This is not a zero score.
How Hagalu rates cars →
Mitsubishi Xpander
Cross 1.5 A/T
Hagalu editorial rating
4.3/5
★★★★★ ★★★★★
Desk research · Exact variant
Hagalu Editorial Team · 2026-08-10
Editorial assessment, not a customer rating. Not road-tested for this review.
Read the review and score breakdown →
Not yet rated means a complete review is not published; it does not mean the vehicle scored zero. Read the rating methodology .
What Each Car Gets Right (and Wrong)
Specification evidence leader
T2
Strengths
More powerful engine output
Stronger listed safety equipment
Weak Spots
Lower fuel efficiency
Lower published practicality figures
Best suited to:
Published Performance
Xpander
Strengths
Better fuel efficiency
Stronger published practicality figures
Weak Spots
Less powerful engine setup
Fewer listed safety features
Best suited to:
Published Efficiency
Published Practicality
Which One's Right for You?
T2
Buyers prioritising the stronger published powertrain figures Buyers prioritising the more complete listed safety equipment
Xpander
Buyers prioritising the lower published fuel or energy use Buyers prioritising the stronger published space and capacity figures
Full Specs, Side by Side
Open a category, then swipe sideways to compare every column
Vehicle Details
▾
Spec
T2
Xpander
Model Introduced Year
2026
2021
Generation
Current local listing
First-generation Xpander, 2025 South African update
Facelift History
Not listed by current South African source page.
Current 2025 equipment and Xpander Cross update.
Facelift Launched Since
2026
Current specification
Facelift Version Ending
Current
Current
Body Style
SUV
MPV
Gross Combined Mass Kg
3855 kg
-
Model Year
Current
2026
Production Status
Active
active
Segment
SUV
Compact seven-seat MPV
Tare Mass Kg
1880 kg
-
Vehicle Type
SUV
Passenger vehicle
Dimensions
▾
Spec
T2
Xpander
Length
4785 mm
4595 mm
Width
2006 mm
1790 mm
Height
1880 mm
1750 mm
Wheelbase
2800 mm
2775 mm
Ground Clearance (Default)
220 mm
225 mm
Ground Clearance (With Full Seating Load)
220 mm
195 mm
Fuel Tank Capacity
70 l
45 l
Boot/Cargo Space
580 l
781 l
Kerb Weight
1880 kg
1275 kg
Gross Vehicle Weight (GVW)
2255 kg
1860 kg
Payload Capacity
375 kg
585 kg
Towing Capacity
1600 kg
550 kg
Seating Capacity
5 seats
7 seats
Number of Rows
2 rows
3 rows
Doors
5 doors
5 doors
Minimum Turning Radius
5.8 m
5.2 m
Front Headroom
1040 mm
1000 mm
Rear Headroom
1020 mm
990 mm
Front Legroom
1055 mm
876 mm
Rear Legroom
935 mm
855 mm
Suspension & Chassis
▾
Spec
T2
Xpander
Front Track Width
1685 mm
-
Rear Track Width
1695 mm
-
Front Suspension
MacPherson strut suspension
MacPherson strut
Rear Suspension
Multi-link independent suspension
Torsion beam
Front Suspension Type
MacPherson strut suspension
MacPherson strut
Rear Suspension Type
Multi-link independent suspension
Torsion beam
Comfort & Convenience
▾
Spec
T2
Xpander
Load Bed Length
Not Applicable
-
Load Bed Width
Not Applicable
-
Climate Control
Dual-zone climate control
Manual air conditioning with rear cooler
Power Windows
Not Available
Front and rear
Keyless Entry
Yes
Yes
Push Button Start
Yes
Yes
Wireless Charging
50W
No
Sunroof
Yes
No
Electric Tailgate
Yes
No
Automatic Headlamps
Yes
-
Rain Sensing Wipers
Yes
No
Boot Space Seats Folded
1494 l
-
AC Type
Dual-zone climate control
Manual air conditioning with rear cooler
Engine Warranty
10-year/1,000,000 km engine warranty
-
Fuel Consumption Combined
9.3
-
Rear Seat Split
60/40
-
Remote Engine Start
Yes
-
Spare Wheel
255/60 R19 full size
Full-size
Loadbox Length Mm
Not Applicable
-
Loadbox Width Mm
Not Applicable
-
Roof Load
300kg static / 100kg dynamic
-
Towbar
Yes
-
Engine & Performance
▾
Spec
T2
Xpander
Engine
2-litre Turbocharged Petrol
1.5-litre Naturally Aspirated Petrol
Engine Code
SQRF4J20
4A91
Fuel Type
Petrol
Petrol
Hybrid System
Not Applicable
Not Applicable
Engine Displacement
1998 cc
1499 cc
Cylinders
4
4
Cylinder Layout
Not Officially Disclosed
Inline
Valves
16
16
Valves per Cylinder
4
4
Aspiration
Turbocharged
Naturally Aspirated
Fuel System
Not Officially Disclosed
Multi-Point Injection
Compression Ratio
10.2:1
10.0:1
Bore
80.5 mm
75 mm
Stroke
98.1 mm
84.8 mm
Maximum Power
180 kW @ 5500 rpm
77 kW @ 6000 rpm
Maximum Torque
375 Nm
141 Nm @ 4000 rpm
Combined Power
Not Applicable
Not Applicable
Combined Torque
Not Applicable
Not Applicable
Motor Type
Not Applicable
Not Applicable
Number of Motors
Not Applicable
Not Applicable
Motor Location
Not Applicable
Not Applicable
Drive Type
4WD
FWD
Transmission
7-Speed DCT
4-Speed Automatic
Top Speed
180 km/h
170 km/h
0-100 km/h
Not Officially Disclosed
15.4 sec
Quarter Mile
Not Officially Disclosed
19.5 sec
Drive Modes
Not Officially Disclosed
No
Launch Control
Not Officially Disclosed
No
Rev Limiter
Not Officially Disclosed
6500 rpm
Power-to-Weight Ratio
Not Officially Disclosed
60.4 kW/tonne
Torque-to-Weight Ratio
Not Officially Disclosed
110.6 Nm/tonne
Battery Capacity
Not Applicable
Not Applicable
Usable Battery Capacity
Not Applicable
Not Applicable
Battery Type
Not Applicable
Not Applicable
Battery Voltage
Not Applicable
Not Applicable
Electric Range
Not Applicable
Not Applicable
AC Charging Power
Not Applicable
Not Applicable
DC Charging Power
Not Applicable
Not Applicable
AC Charging Time
Not Applicable
Not Applicable
DC Charging Time
Not Applicable
Not Applicable
Regenerative Braking
Not Applicable
Not Applicable
Transmission & Drivetrain
▾
Spec
T2
Xpander
Gearbox
Automatic
4-Speed Automatic
Drivetrain Layout
4WD
Front-engine, front-wheel drive
LSD Available
Multi-Plate Clutch Limited-Slip Differential
No
Transfer Case
Not Applicable
Not Applicable
Differential Lock
Rear Electronic Limited-Slip Differential
No
Paddle Shifters
Not Applicable
No
Final Drive Ratio
Not Applicable
4.375
Number of Gears
7
4
Transmission Type
7DCT
Automatic
Clutch Type
Not Applicable
Torque converter
Gear Shift Indicator
Not Applicable
Yes
Gear Shift Type
Not Applicable
Floor-mounted selector
Drivetrain
4WD
FWD
4WD Engagement
Not Applicable
Not Applicable
4WD Hi Range
Not Applicable
Not Applicable
4WD Lo Range
Not Applicable
Not Applicable
4WD Selector
Not Applicable
Not Applicable
Automatic Shift Paddles
Not Applicable
No
Front Differential Lock
Not Applicable
No
Gearbox Type
7DCT
4-Speed Automatic
Low Range Ratio
Not Applicable
Not Applicable
Low Range
Not Applicable
Not Applicable
Axle Layout
2WD
4x2
Rear Differential Lock
Not Applicable
No
Transmission Speeds
7
4
Mileage & Efficiency
▾
Spec
T2
Xpander
Claimed Mileage
10.8 km/l
14.3 km/l
City Mileage
7.6 km/l
11.7 km/l
Highway Mileage
10.8 km/l
16.4 km/l
Fuel Tank Capacity
70 l
45 l
Emission Standard
VI B
Euro 2
AdBlue Tank Capacity
Not Applicable
Not Applicable
Auto Start Stop
Not Applicable
No
Real-world Mileage
10.8 km/l
14.3 km/l
Charging Port Type
Not Applicable
Not Applicable
Charging Type
Not Applicable
Not Applicable
Fuel Tank Litres
70
45
Combined Driving Range
Not Applicable
643
Electric Consumption
Not Applicable
Not Applicable
Range Real World Highway
Not Applicable
665 km
Range Real World Mixed
Not Applicable
598 km
Safety
▾
Spec
T2
Xpander
Airbags
Front, front side, and curtain airbags
2
ABS
Yes
Yes
Electronic Stability Control
Yes
Yes
Traction Control
Yes
Yes
Hill Descent Control
Yes
No
Hill Start Assist
Not Available
Yes
Child Safety Lock
Yes
Yes
ISOFIX Mounts
Yes
Yes
Brake Assist
Not Available
Yes
Tyre Pressure Monitor
Yes
No
Engine Immobiliser
Not Available
Yes
Seatbelt Warning All Seats
Not Available
Yes
Front Parking Sensors
Yes
No
AEB
Yes
No
BA
Not Available
Yes
Brake Override System
Not Available
No
Curtain Airbags
Front, front side, and curtain airbags
No
Driver Airbag
Not Available
Yes
EBD
Yes
Yes
Engine Immobiliser
Not Available
Yes
Hill Hold
Not Available
Yes
Passenger Airbag
Not Available
Yes
Rear Cross Traffic Alert
Yes
No
Seatbelt Pretensioners
Not Available
Yes
Seatbelt Reminder
Not Available
Yes
Side Airbags
Front, front side, and curtain airbags
No
Stability Control
Yes
Yes
TCS
Yes
Yes
Knee Airbag
Not Available
No
ABS EBD
Yes
Yes
Driver Assistance
▾
Spec
T2
Xpander
Cruise Control
No
Yes
Adaptive Cruise Control
Yes
No
Lane Keep Assist
Not Available
No
Lane Departure Warning
Not Available
No
Blind Spot Monitoring
Yes
No
Rear Cross Traffic Alert
Yes
No
Parking Sensors
Not Available
No
Rear View Camera
Not Available
Yes
360 Degree Camera
Yes
No
Autonomous Emergency Braking
Yes
No
Driver Fatigue Alert
Not Available
No
Traffic Sign Recognition
Not Available
No
Auto Highbeam
Not Available
No
Auto Wipers
Yes
No
Rear Parking Sensors
Yes
No
Reverse Camera
Not Available
Yes
Adaptive Cruise Control
Yes
No
Park Assist
Not Available
No
Around View Monitor
Yes
No
Blind Spot Warning
Yes
No
Forward Collision Warning
Yes
No
Interior
▾
Spec
T2
Xpander
Seat Material
Black synthetic leather with red stitching
High-grade fabric
Heated Seats
Not Applicable
No
Ventilated Seats
Not Applicable
No
Ambient Lighting
Multi
No
Front Shoulder Room
Not Applicable
-
Rear Shoulder Room
Not Applicable
-
Rear AC Vents
Yes
-
Steering Wheel Material
Not Applicable
Leather
60 40 Split Seat
Not Applicable
Yes
Driver Seat Adjustment
Not Applicable
Manual adjustable
Passenger Seat Adjustment
Not Applicable
Manual adjustable
Seat Trim
Black synthetic leather with red stitching
High-grade fabric
Infotainment & Connectivity
▾
Spec
T2
Xpander
Infotainment System
15.6-inch infotainment system
Smartphone-link Display Audio
Apple CarPlay
Wireless
Yes
Android Auto
Wireless
Yes
Bluetooth Connectivity
Yes
Yes
Number of Speakers
12 Sony speakers including subwoofer
6
Digital Instrument Cluster
10.25-inch
8-inch colour LCD meter
USB Ports
Front Type-A/Type-C and rear Type-A/Type-C
Front and second row
Infotainment Screen
Not Available
9-inch
Touchscreen
Not Available
9-inch
Exterior
▾
Spec
T2
Xpander
LED Headlamps
Yes
Yes
Daytime Running Lamps
Yes
Yes
Fog Lamps
Yes
Yes
Roof Rails
Yes
Yes
Exterior Colour Options
See OEM source page for colour availability.
Quartz White Pearl, Graphite Grey Metallic, Blade Silver Metallic, Sunrise Orange Metallic
Headlamps
Yes
Yes
Headlight Type
Yes
Yes
Headlights
Yes
Yes
Panoramic Sunroof
Yes
No
Off-road Capability
▾
Spec
T2
Xpander
Approach Angle
Not Available
Not Applicable
Departure Angle
Not Available
Not Applicable
Wading Depth
Not Available
Not Applicable
Terrain Modes
Normal, Sport, Snow, Mud, Sand, Rock, Eco
No
Locking Differential
Rear Electronic Limited-Slip Differential
Not Applicable
Underbody Protection
Metal guard plate for front compartment
-
4WD System Type
Not Applicable
Not Applicable
Breakover Angle
Not Available
Not Applicable
Ground Clearance Max
220 mm
-
Ground Clearance Min
220 mm
-
Crawl Control
Yes
-
Tyres, Wheels & Brakes
▾
Spec
T2
Xpander
Tyre Size
255/60 R19
205/55 R17
Front Brake Type
Ventilated disc brake
Ventilated disc
Rear Brake Type
Solid disc brake
Drum
Spare Wheel Type
255/60 R19 full size
Full-size
Wheel Rim Size
19
17-inch alloy
Brake Type Front
Ventilated disc brake
-
Brake Type Rear
Solid disc brake
-
Spare Tyre
255/60 R19 full size
Full-size
Electric Park Brake
Yes
-
Handbrake Type
Not Applicable
Manual lever
Towing Unbraked Kg
750 kg
-
Wheel Material
Alloy
-
Environmental & Emissions
▾
Spec
T2
Xpander
CO2 Emissions
210 g/km
164 g/km
Start Stop System
Yes
-
Fuel Octane Requirement
Petrol
-
Service & Maintenance
▾
Spec
T2
Xpander
Service Plan
7-year/75,000 km service plan
2 years / 30,000 km; 15,000 km intervals
Pricing & Ownership
▾
Spec
T2
Xpander
Ownership Role
South Africa market model
New vehicle sold through Mitsubishi Motors South Africa
Price Zar
679900 ZAR
419995 ZAR
Pricing Role
flagship
Official South African recommended retail price
Starting Price
679900
419995
Starting Price Zar
679900
419995
Warranty
▾
Spec
T2
Xpander
Warranty
10-year/1,000,000 km engine warranty
3 years / 100,000 km
In depth: how these cars differ
This T2 and Xpander comparison uses the exact derivatives selected above for South Africa. The catalogue index covers performance, efficiency, safety equipment, practicality and ownership cover only where comparable source-backed fields are present.
Performance index: T2 77 vs Xpander 29.
Efficiency index: T2 43 vs Xpander 56.
Safety-equipment index: T2 93 vs Xpander 36.
Practicality index: T2 70 vs Xpander 76.
Ownership-cover index: T2 not separately scored vs Xpander not separately scored.
These figures are Hagalu catalogue-comparison indicators, not customer ratings, crash-test scores, resale guarantees or a substitute for a road test. Each page shows its weighted source coverage beside the result.
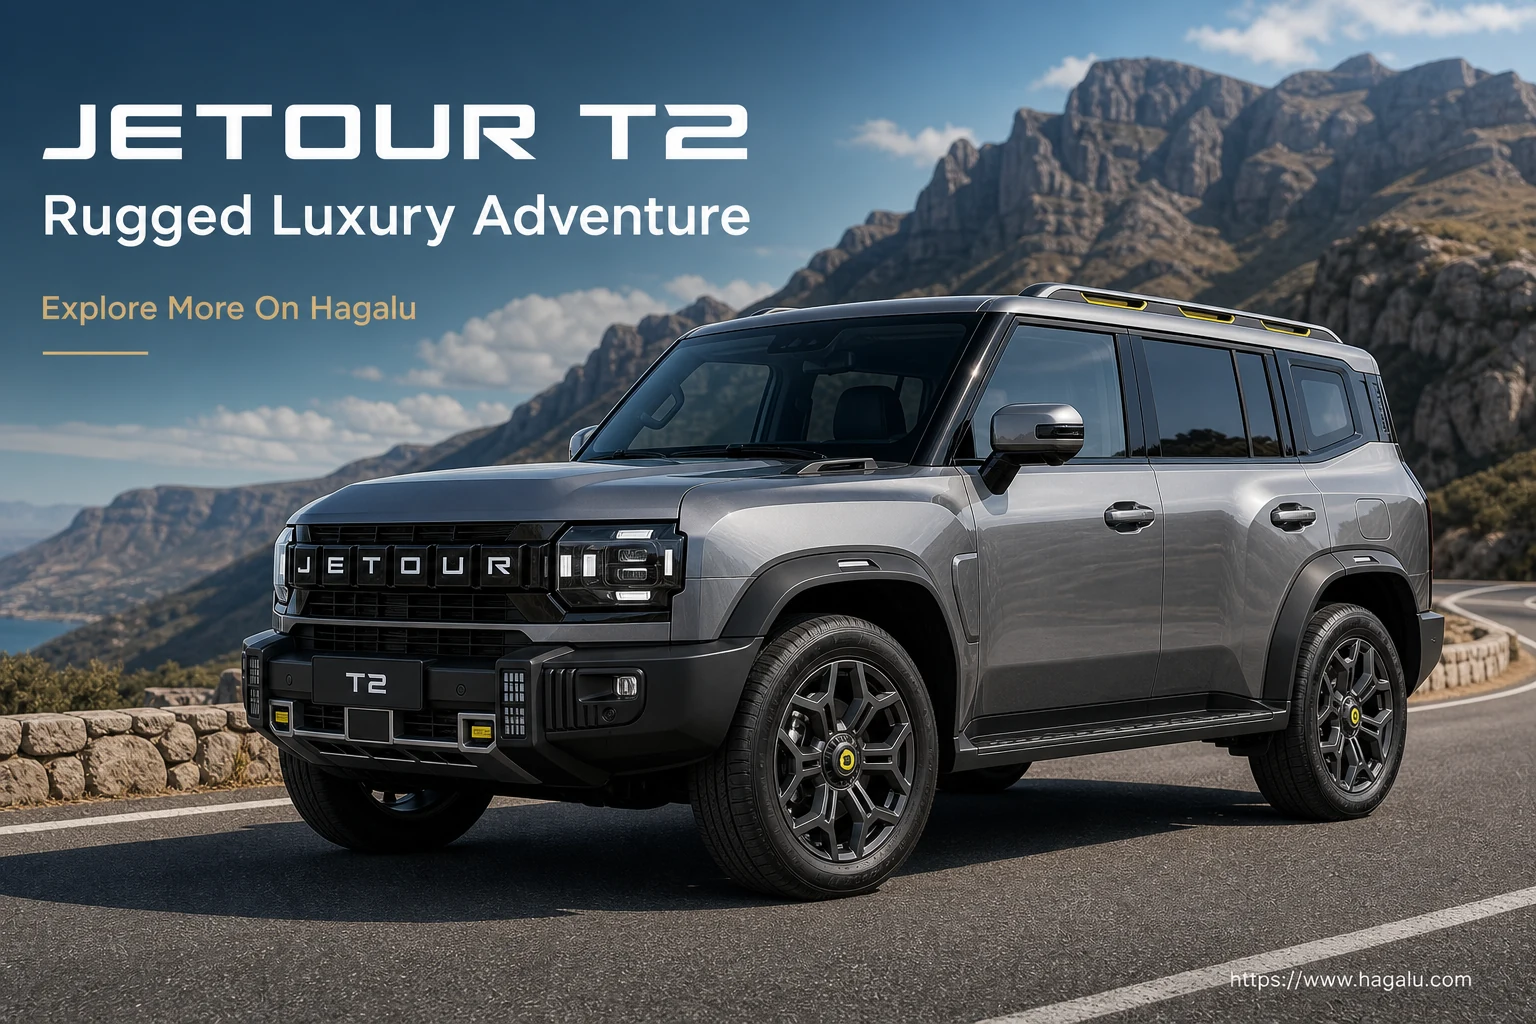
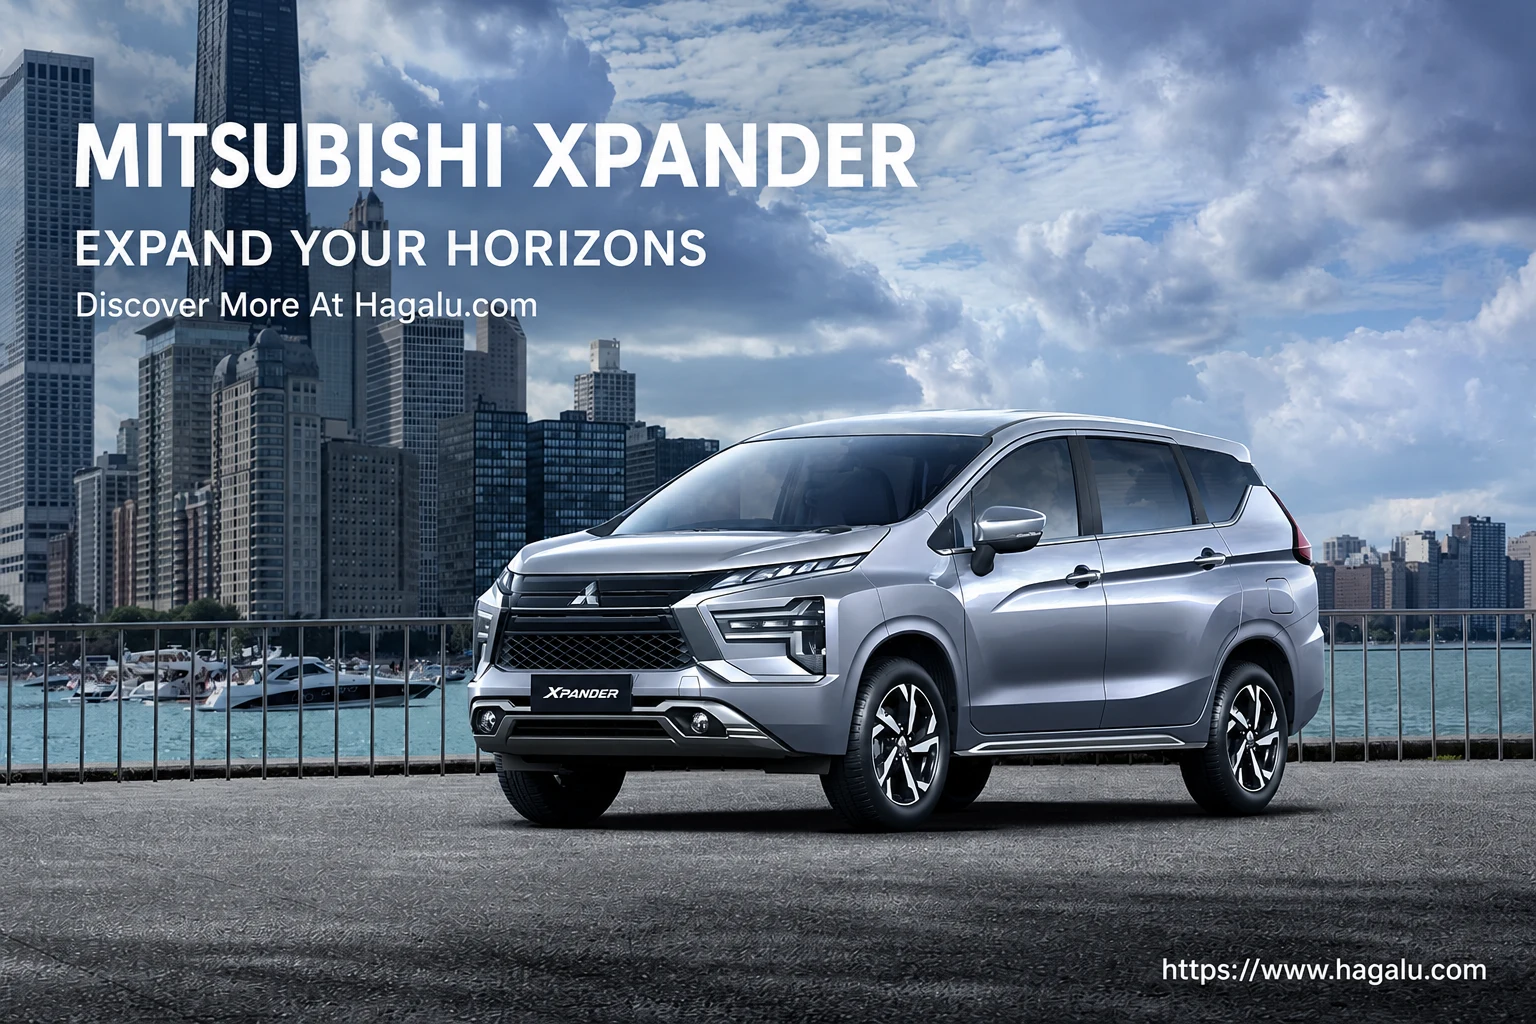
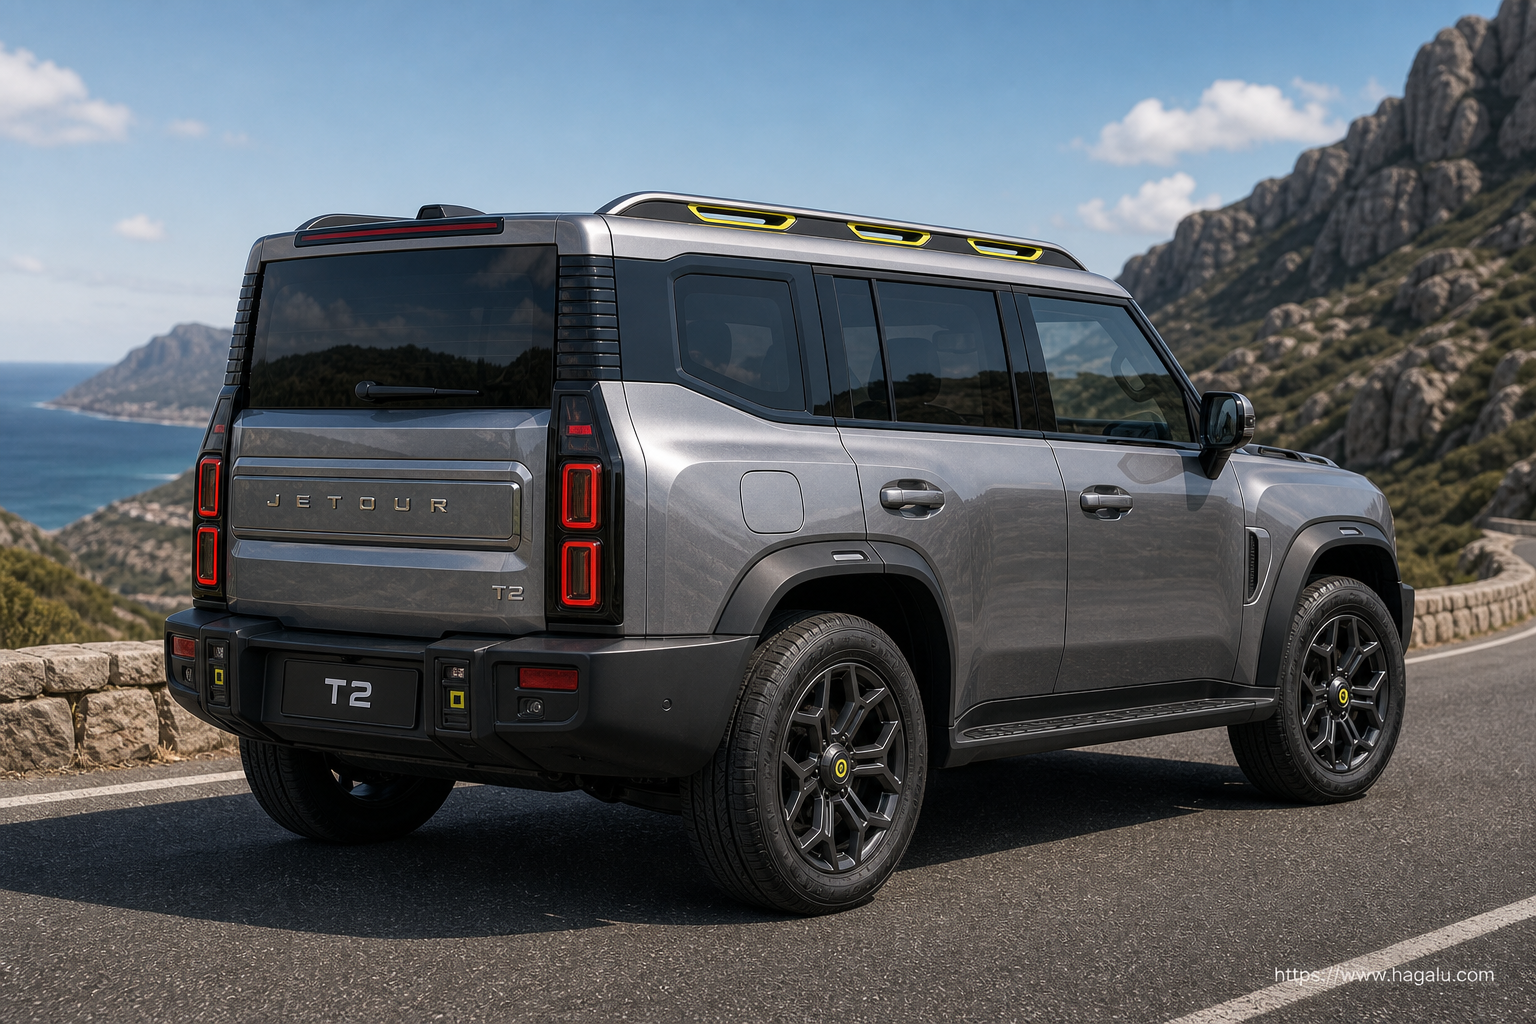
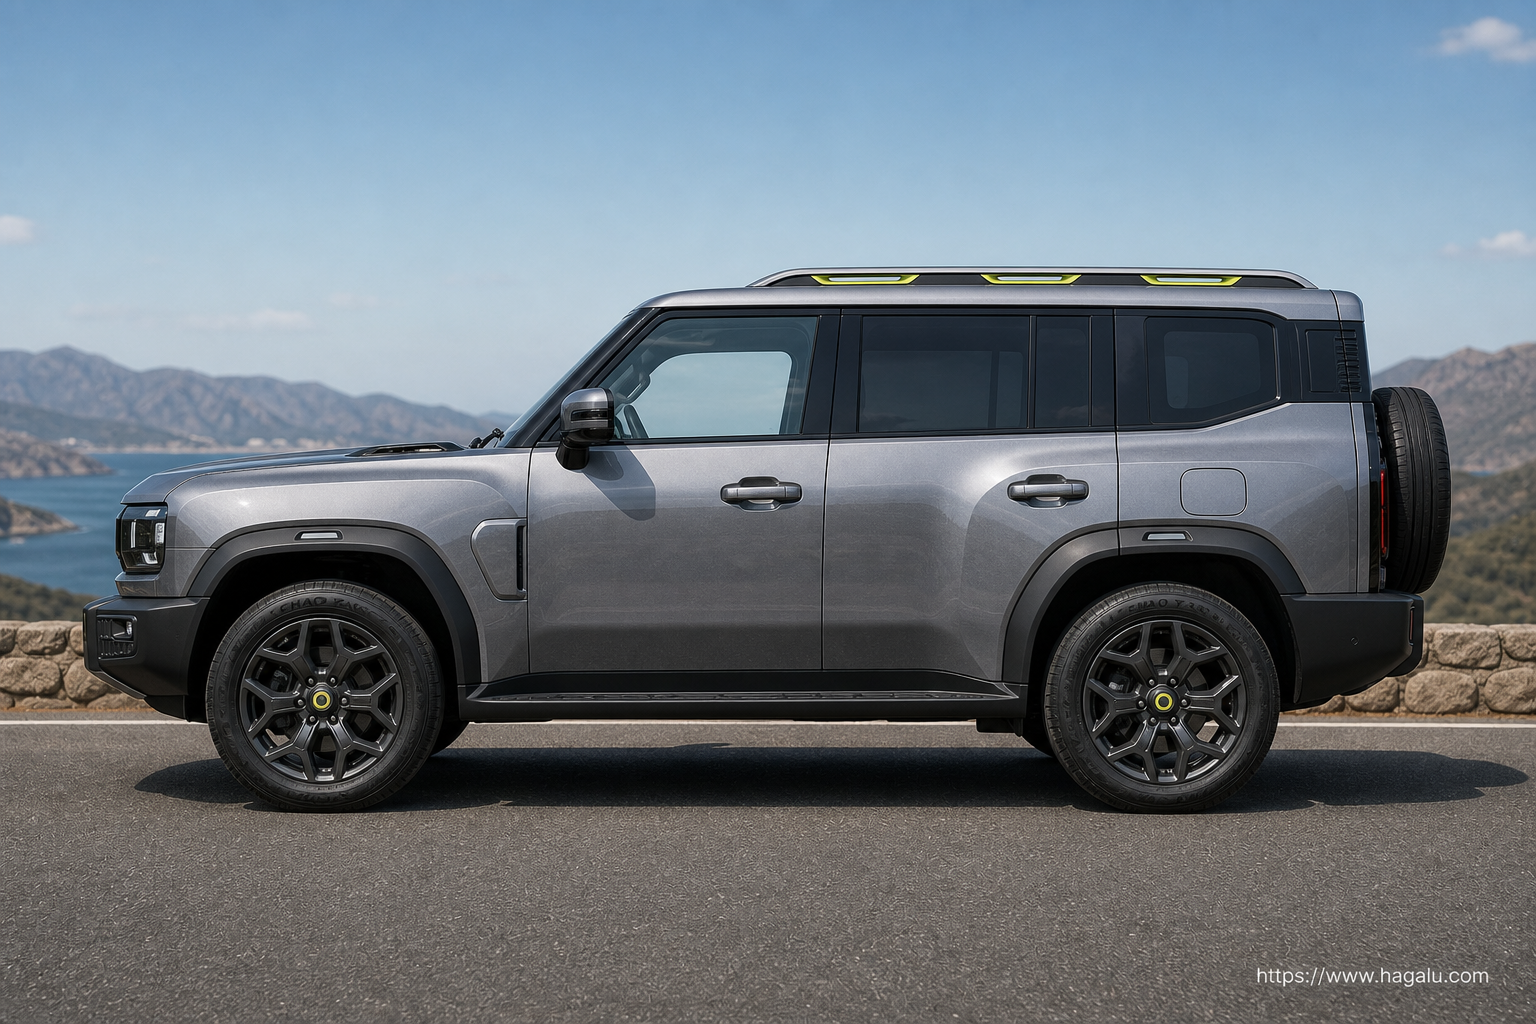
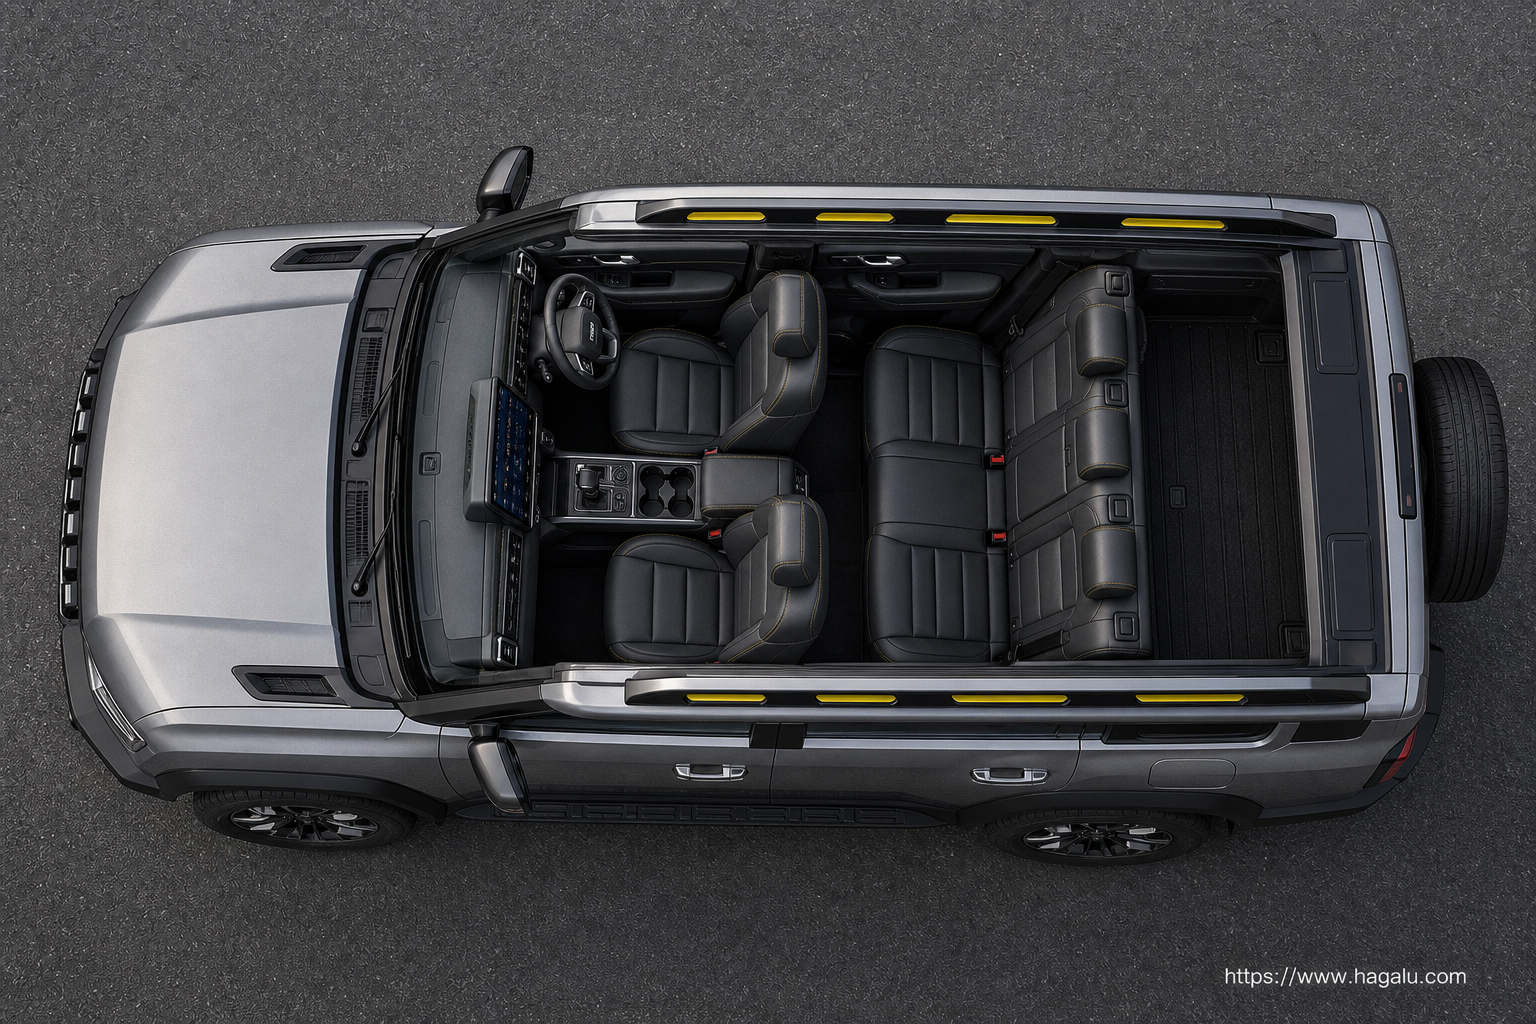
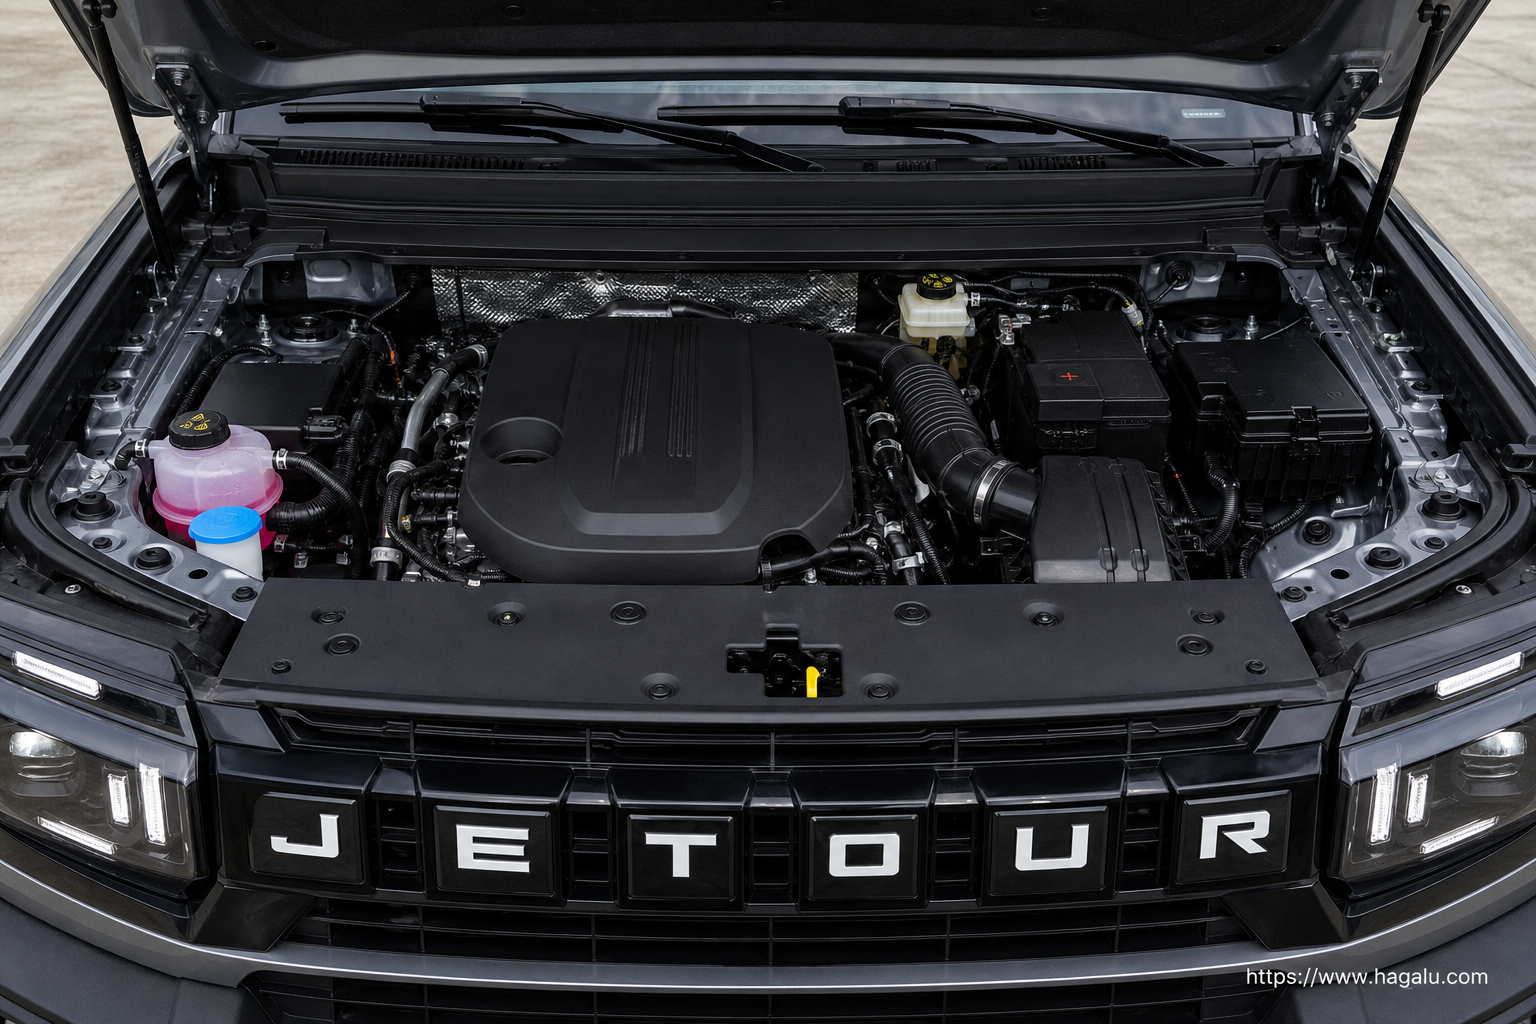
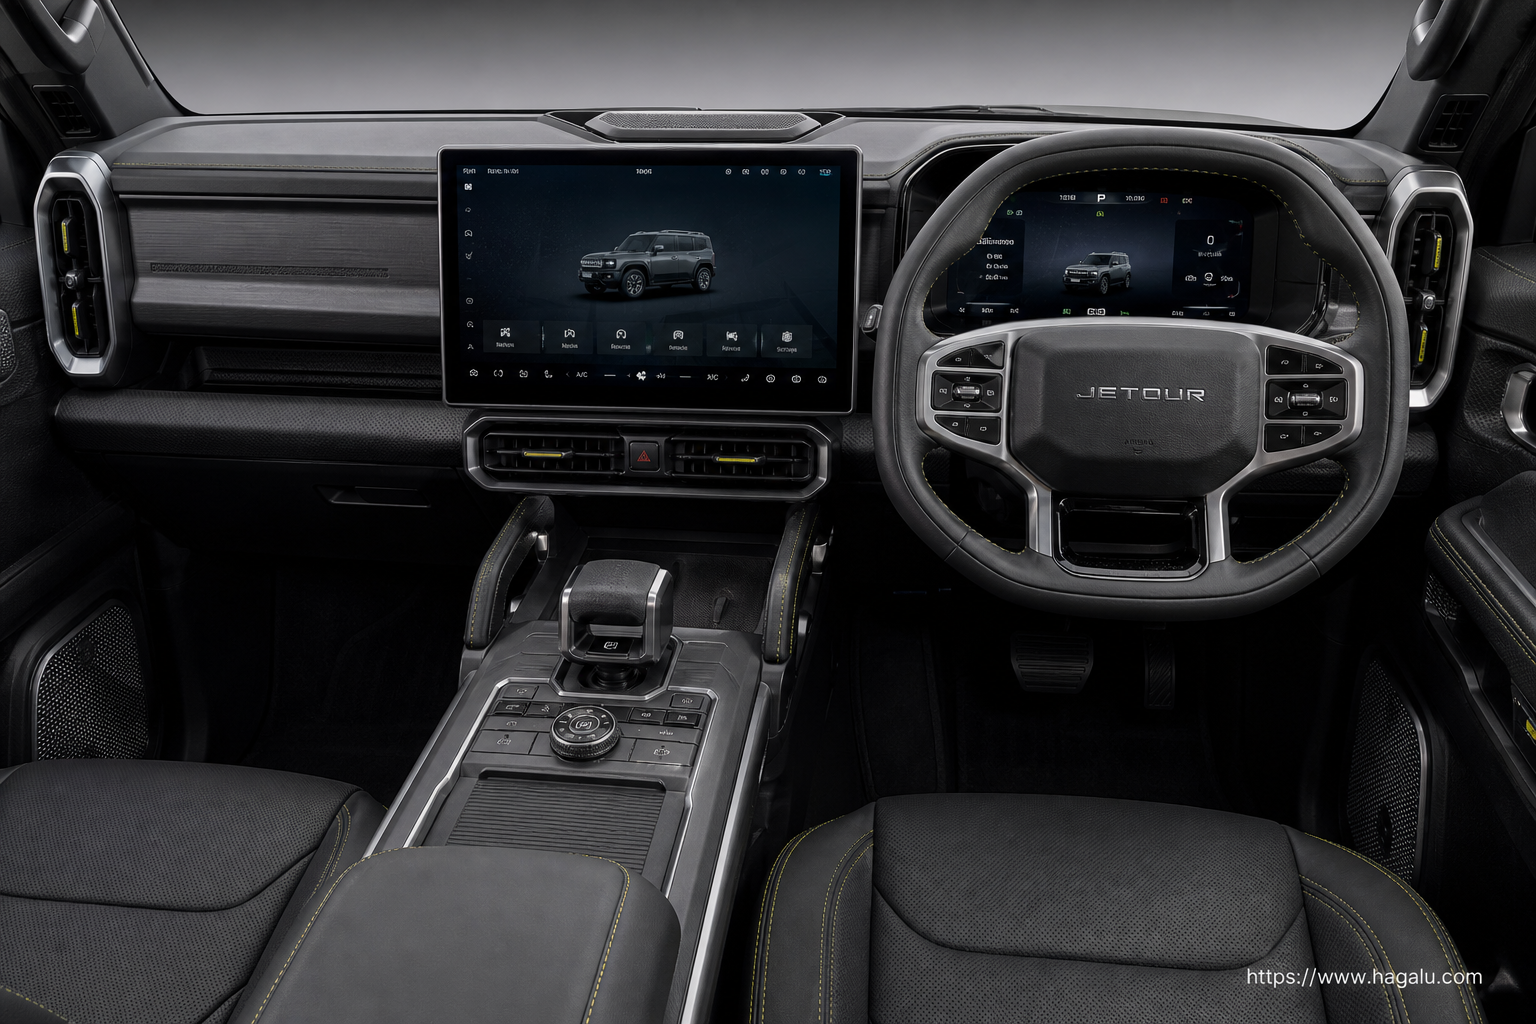
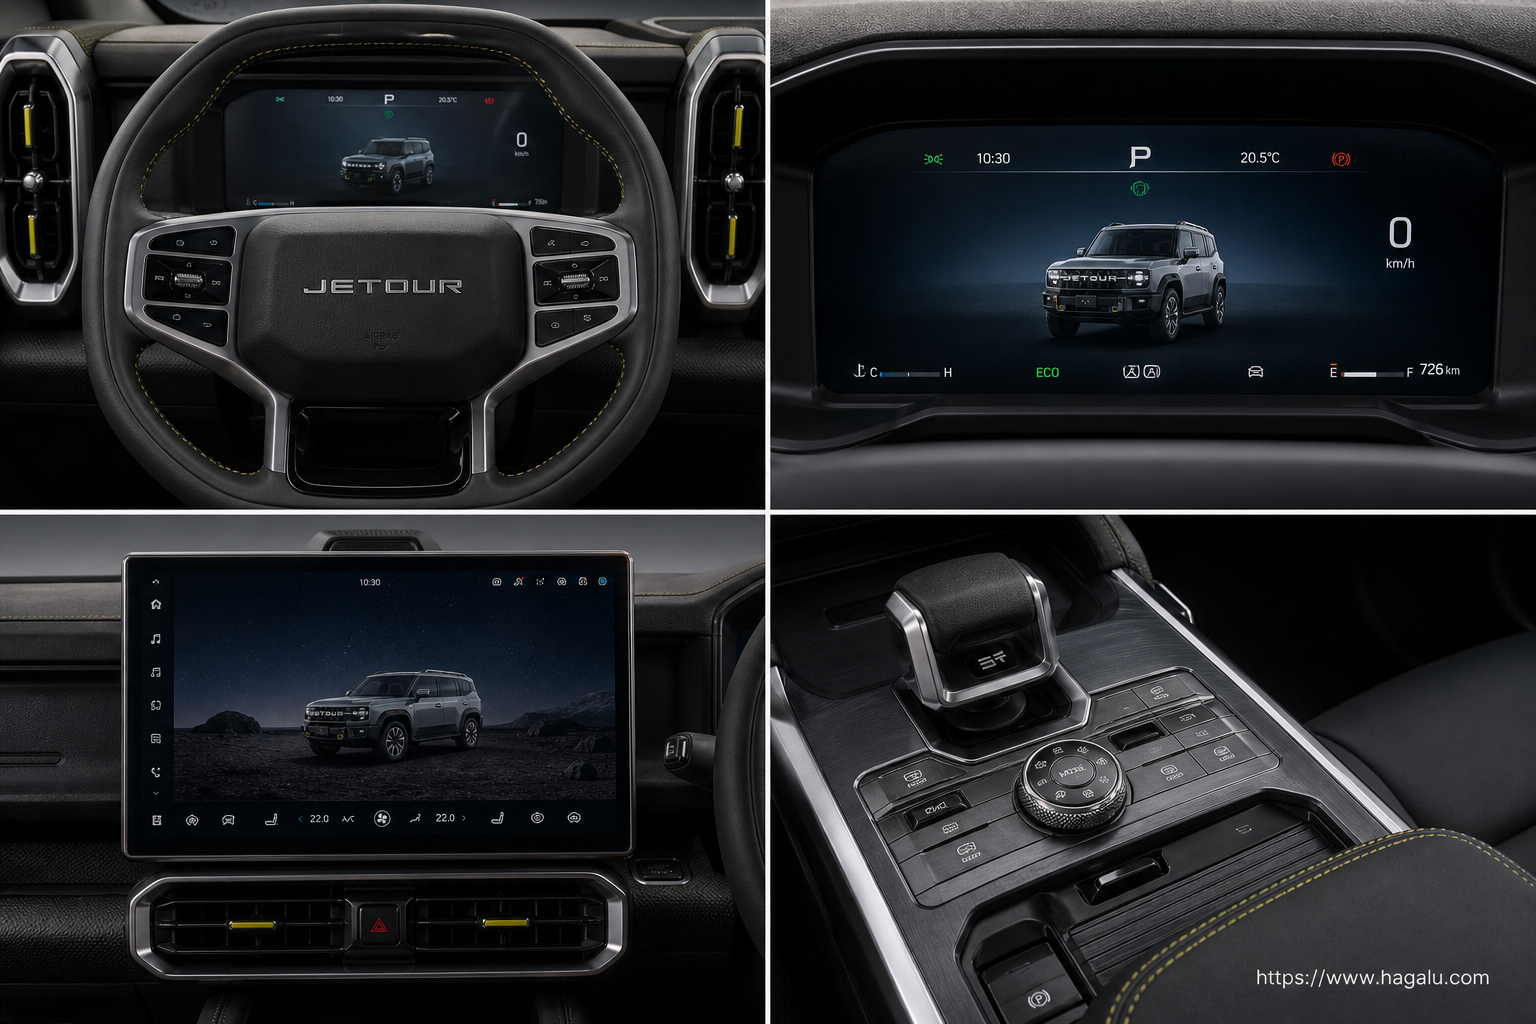
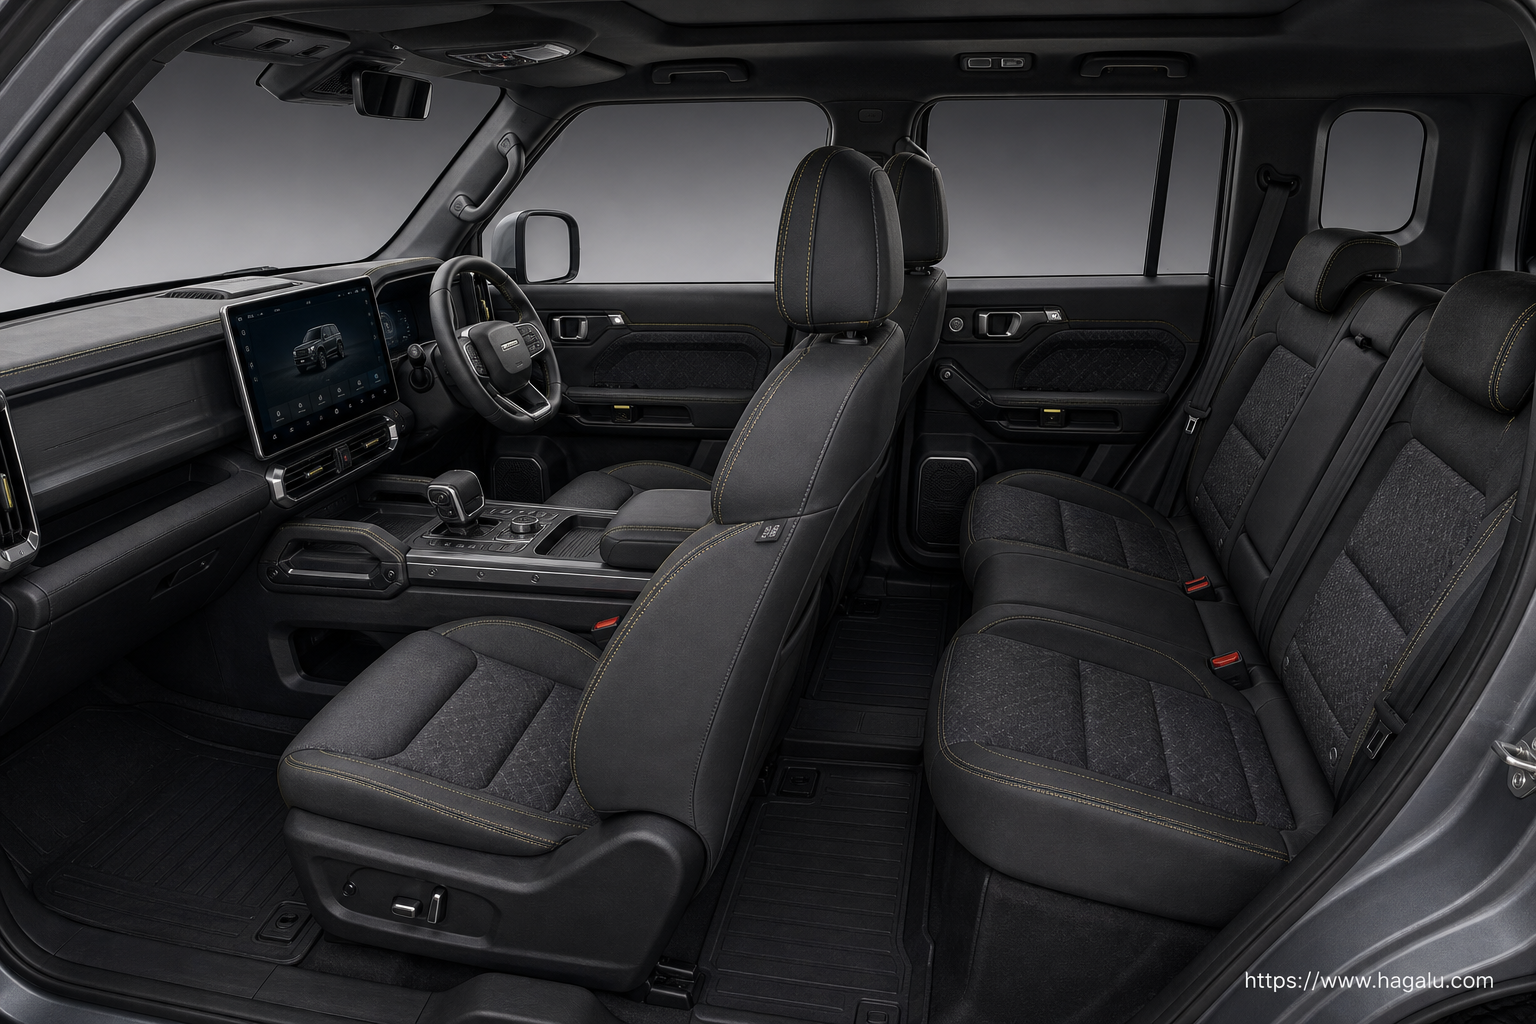
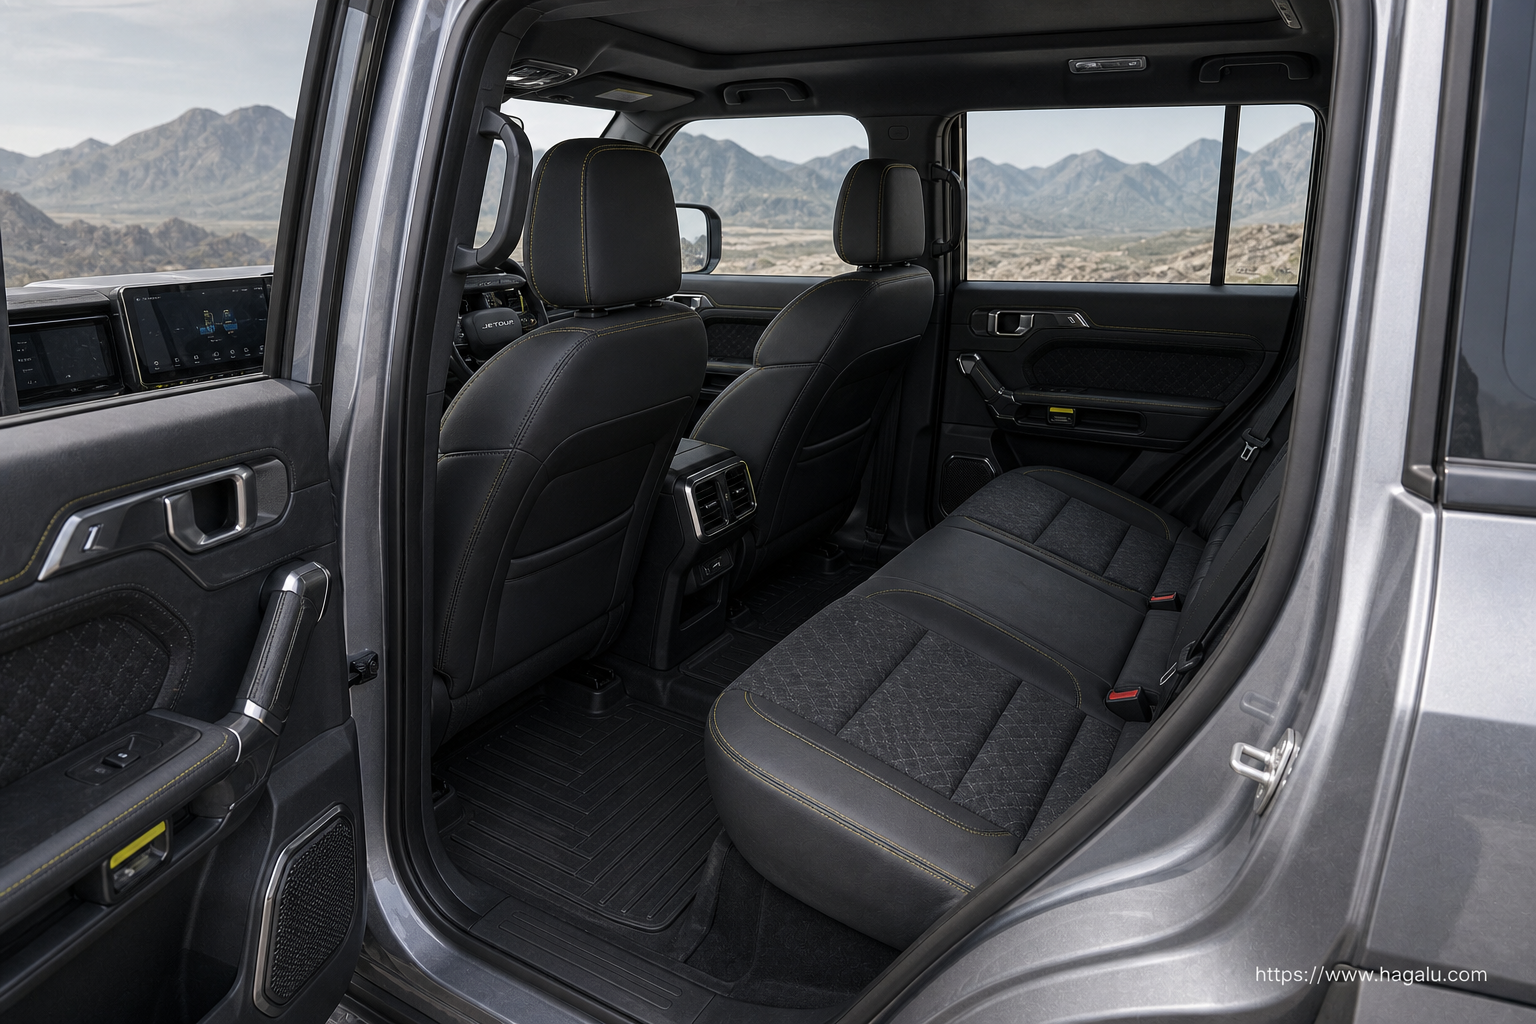
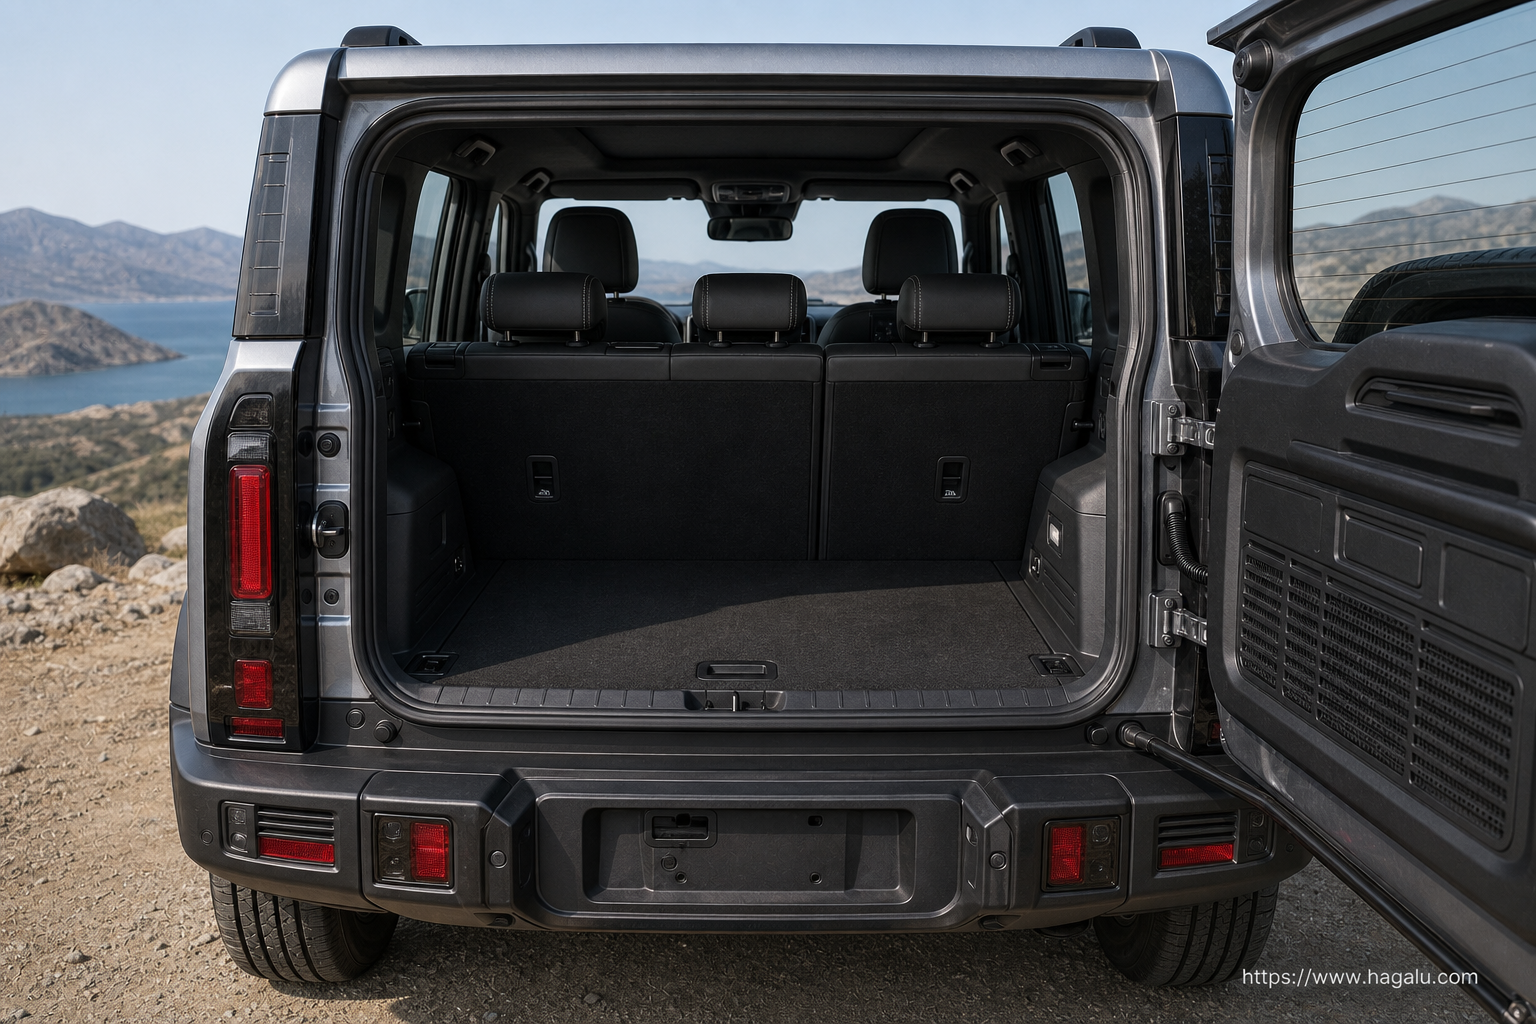
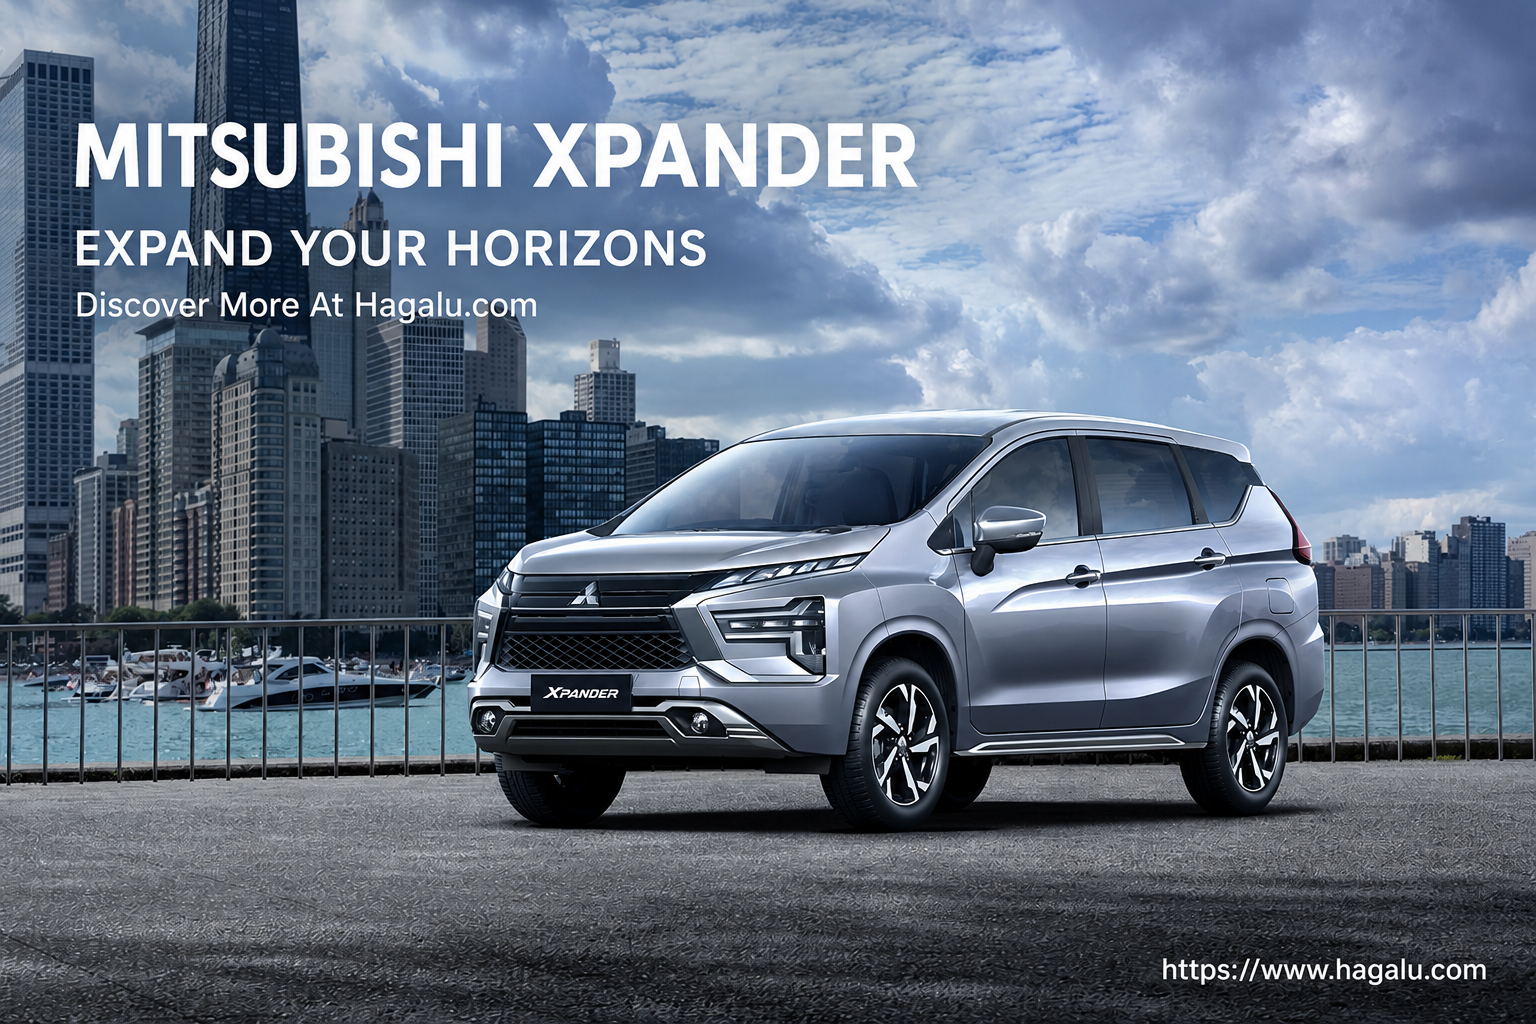
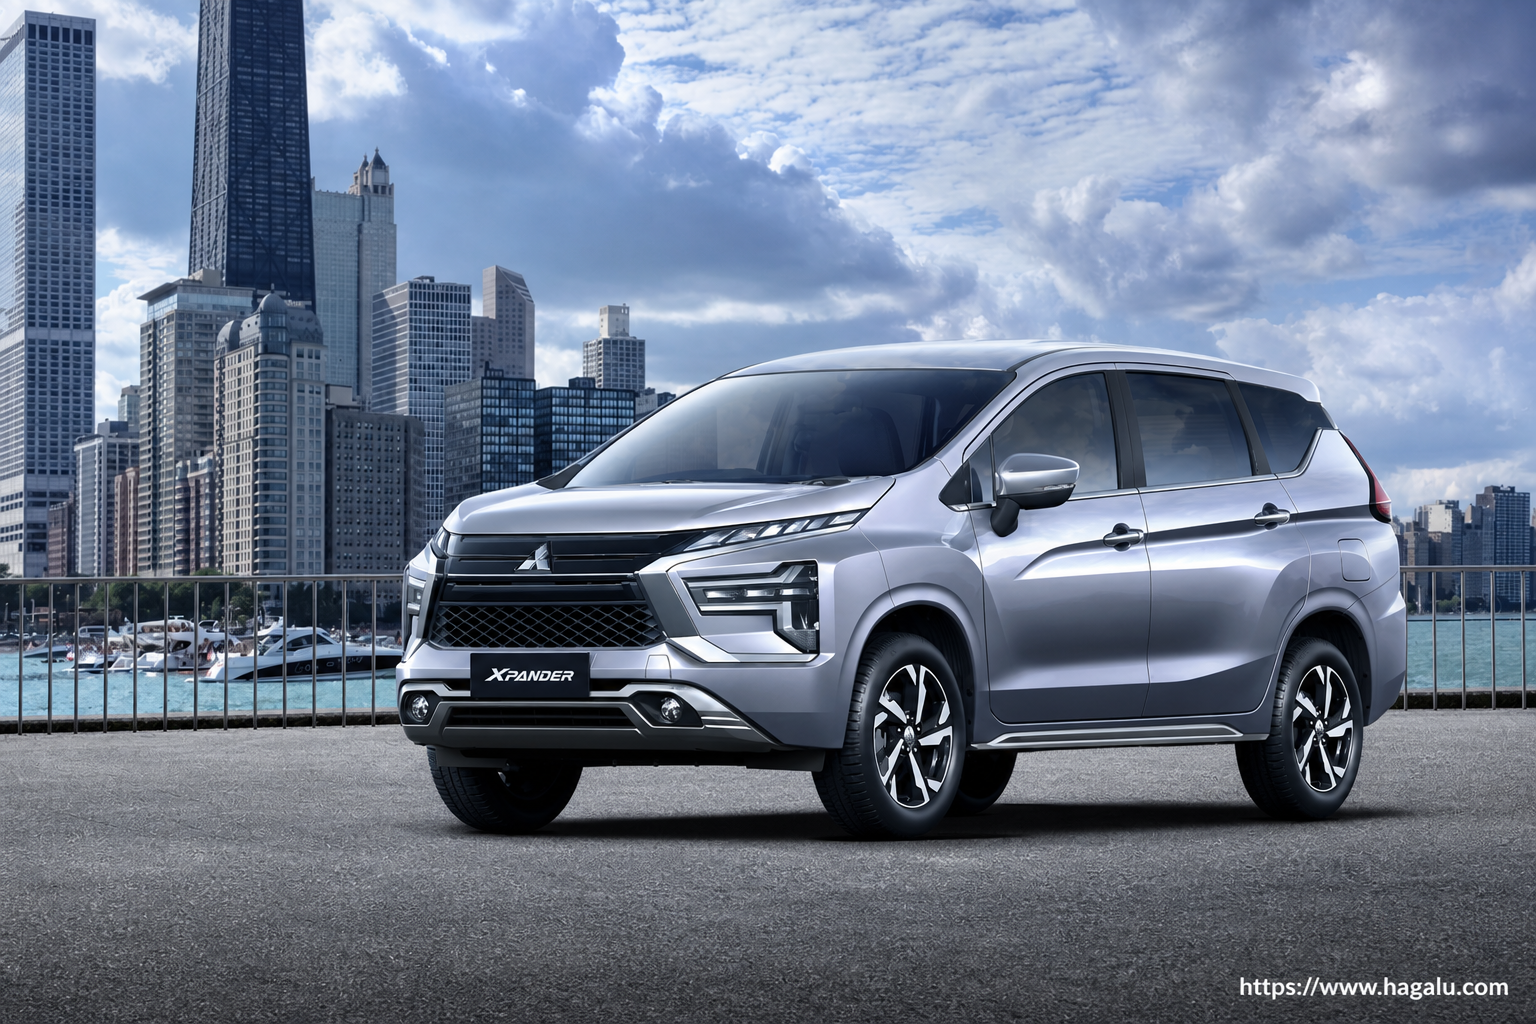
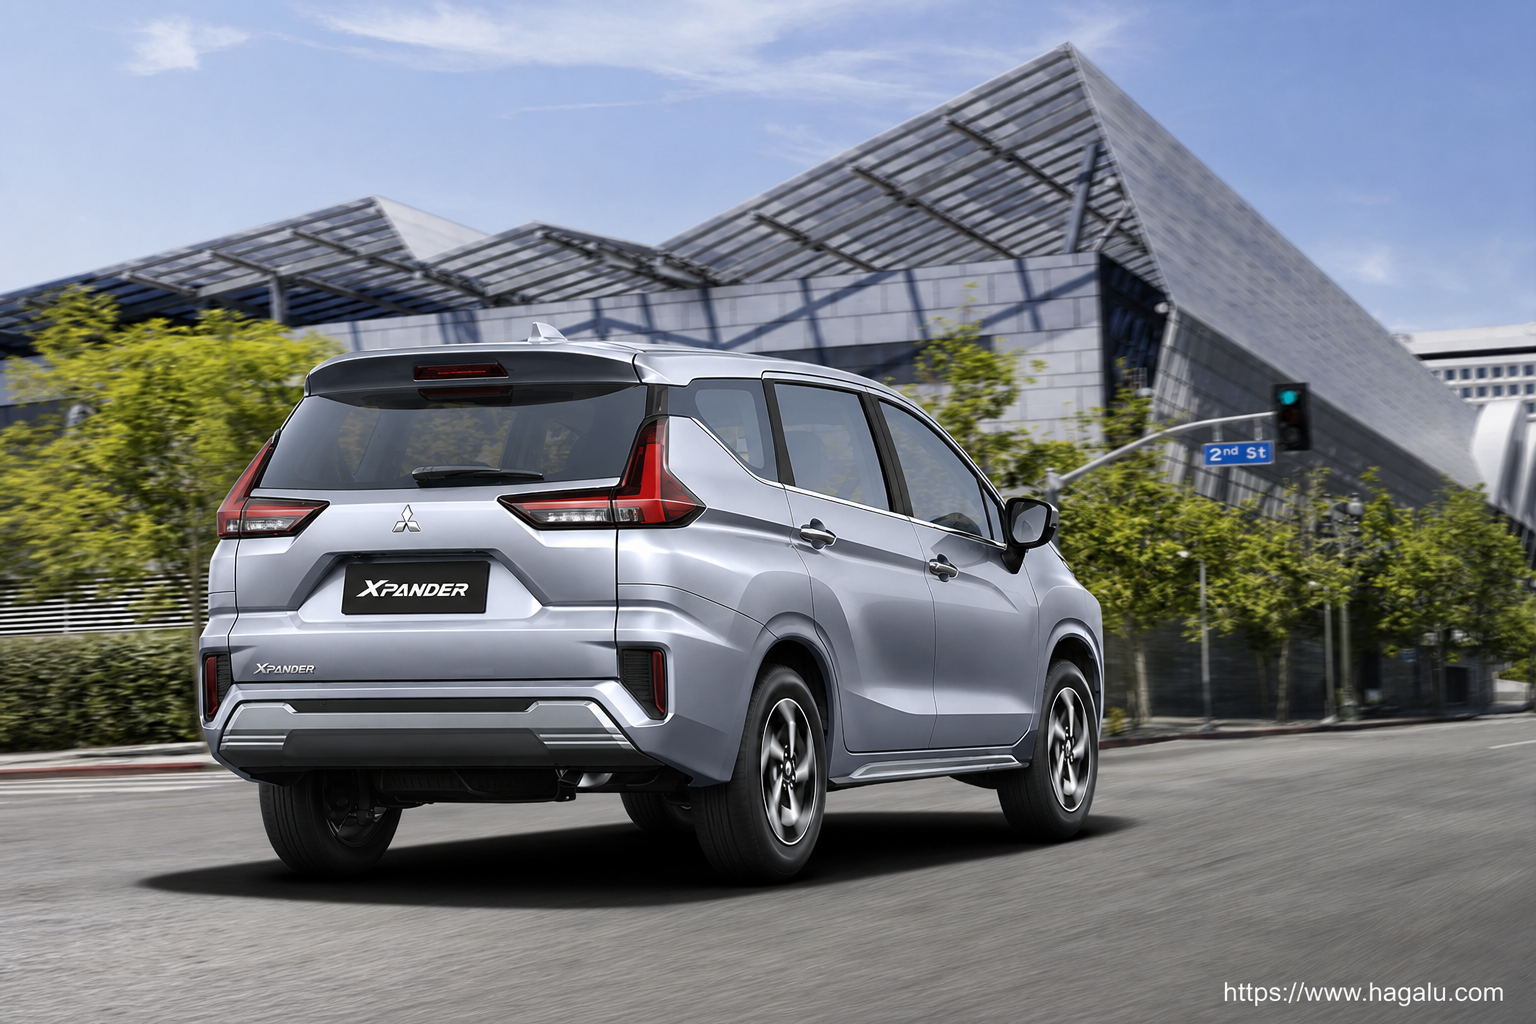
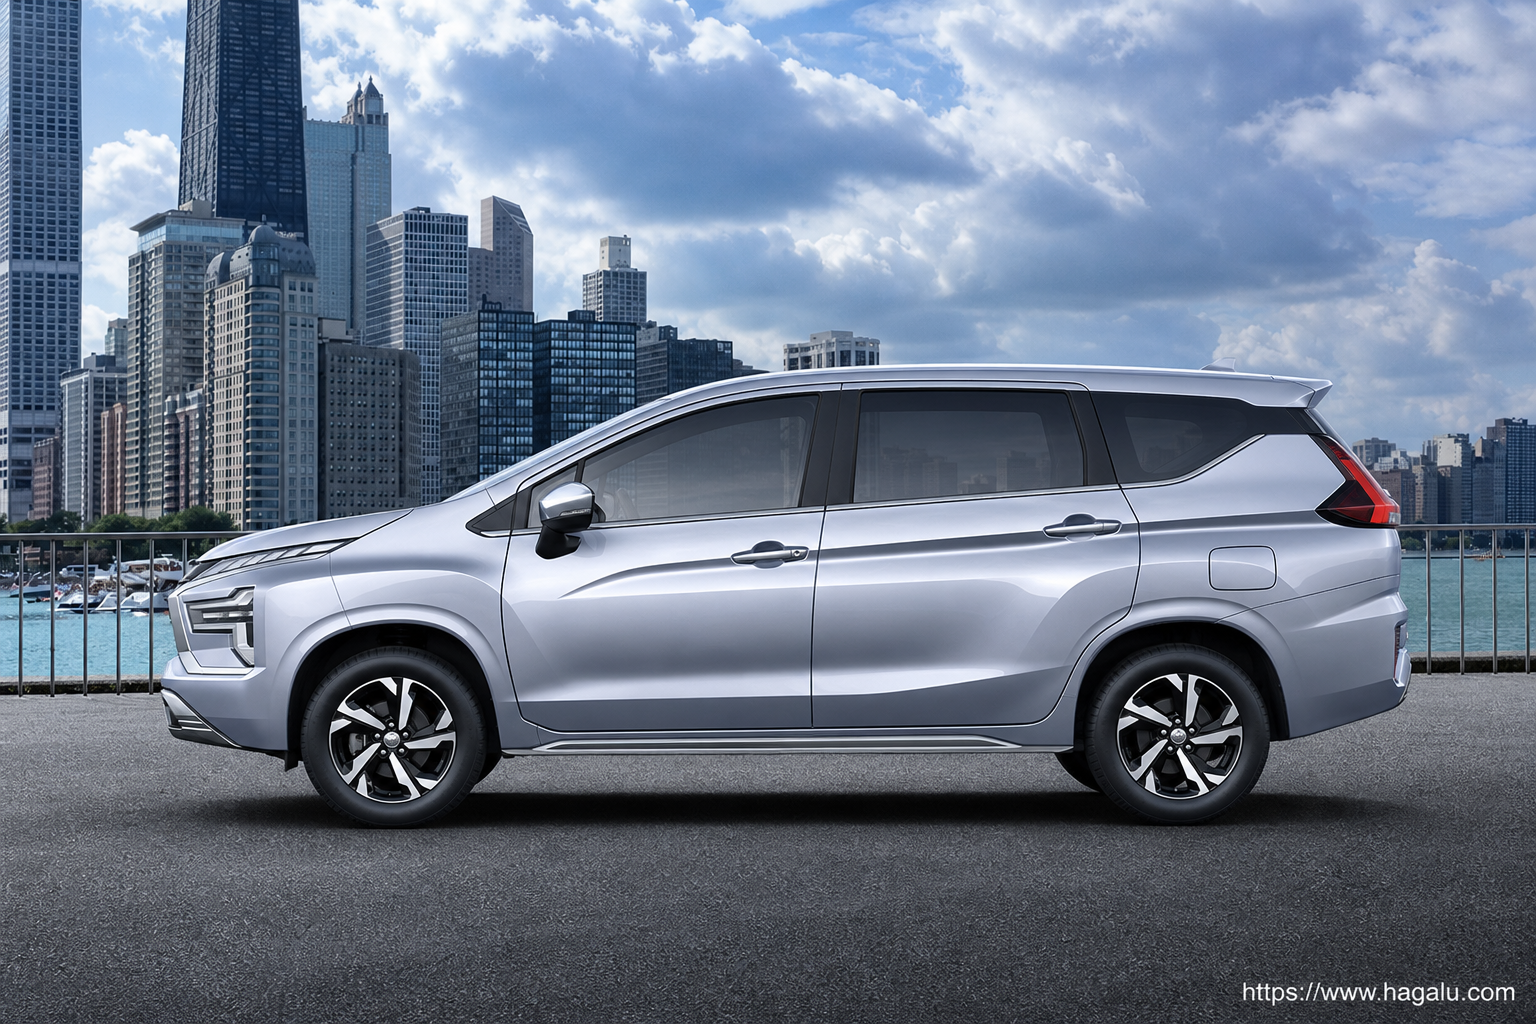
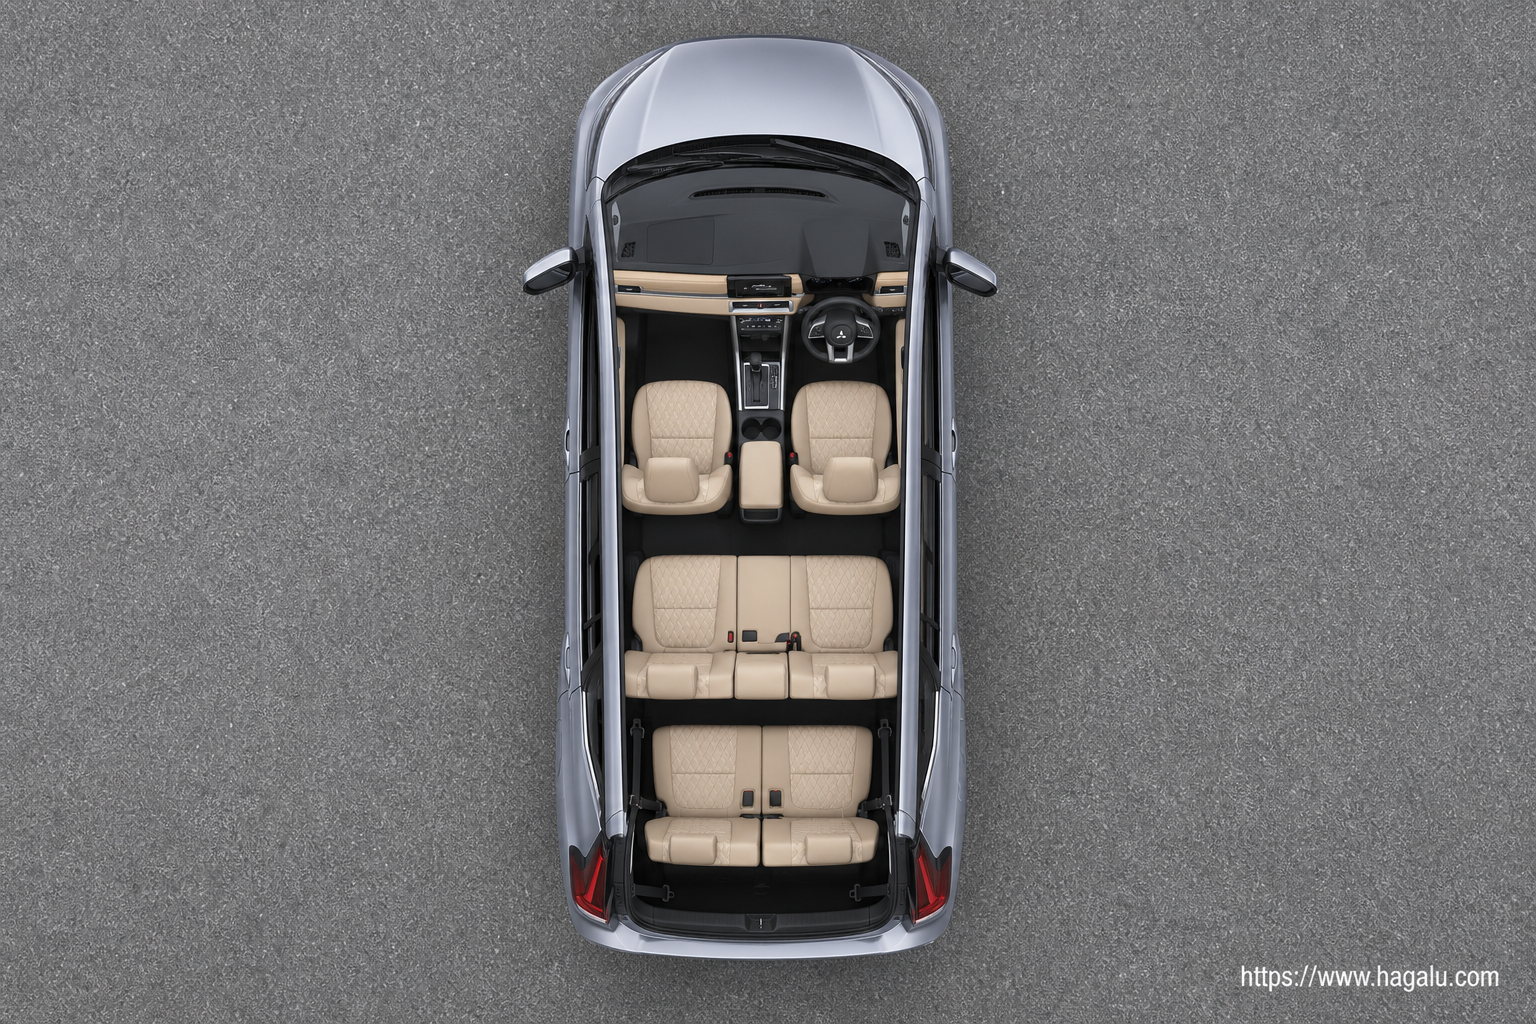
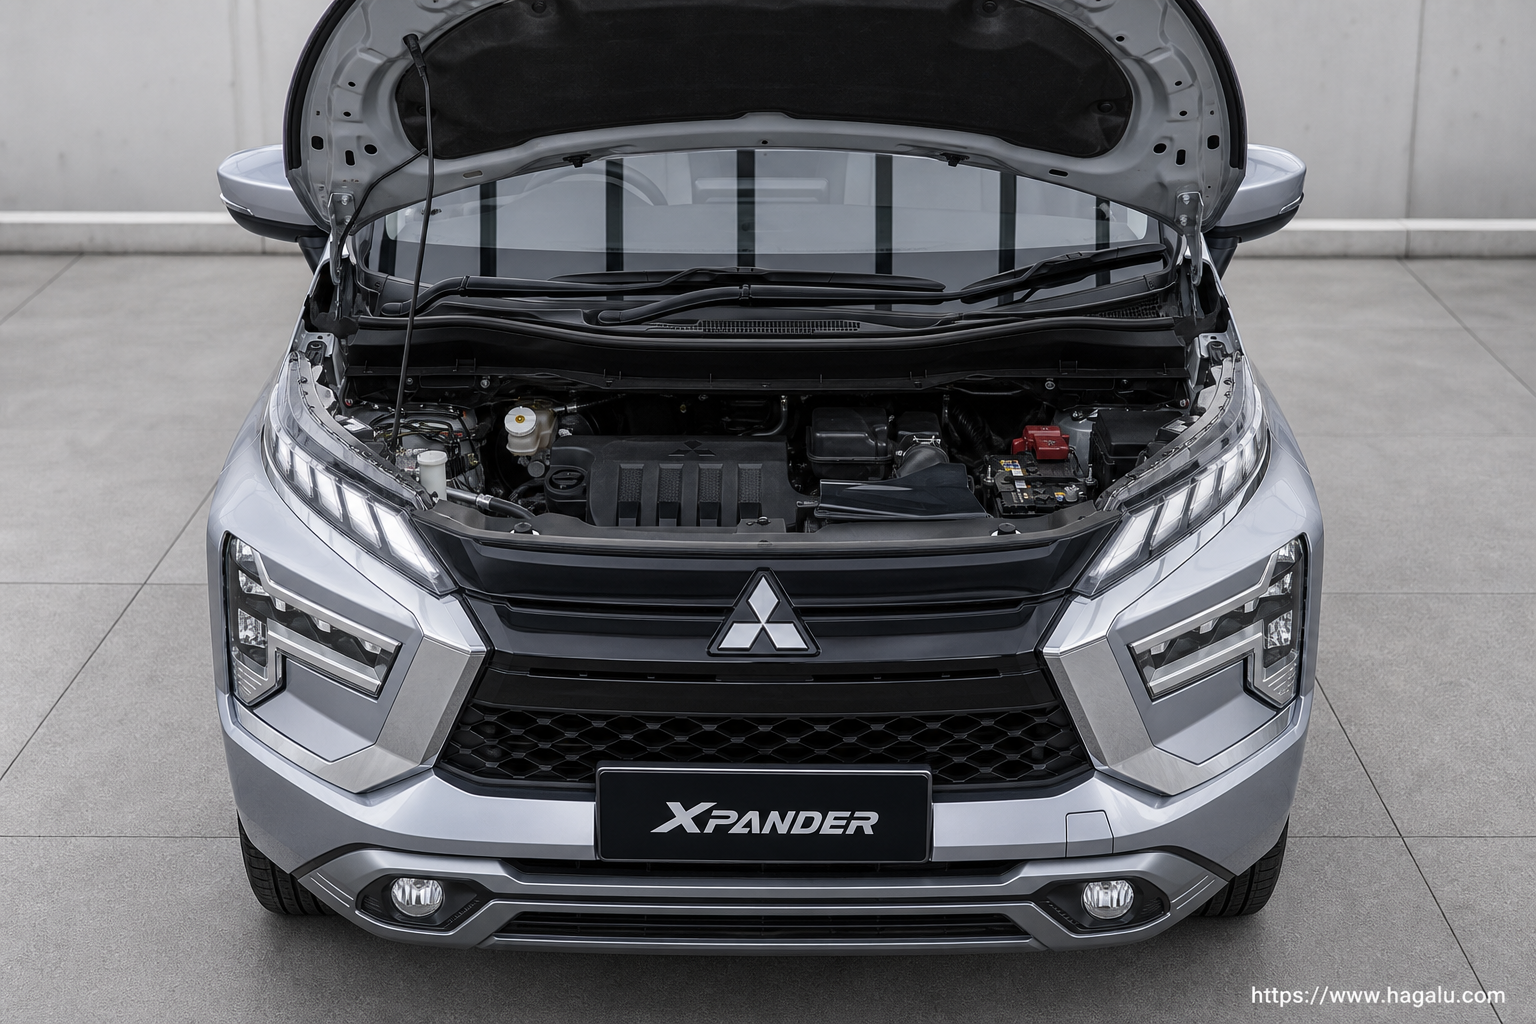
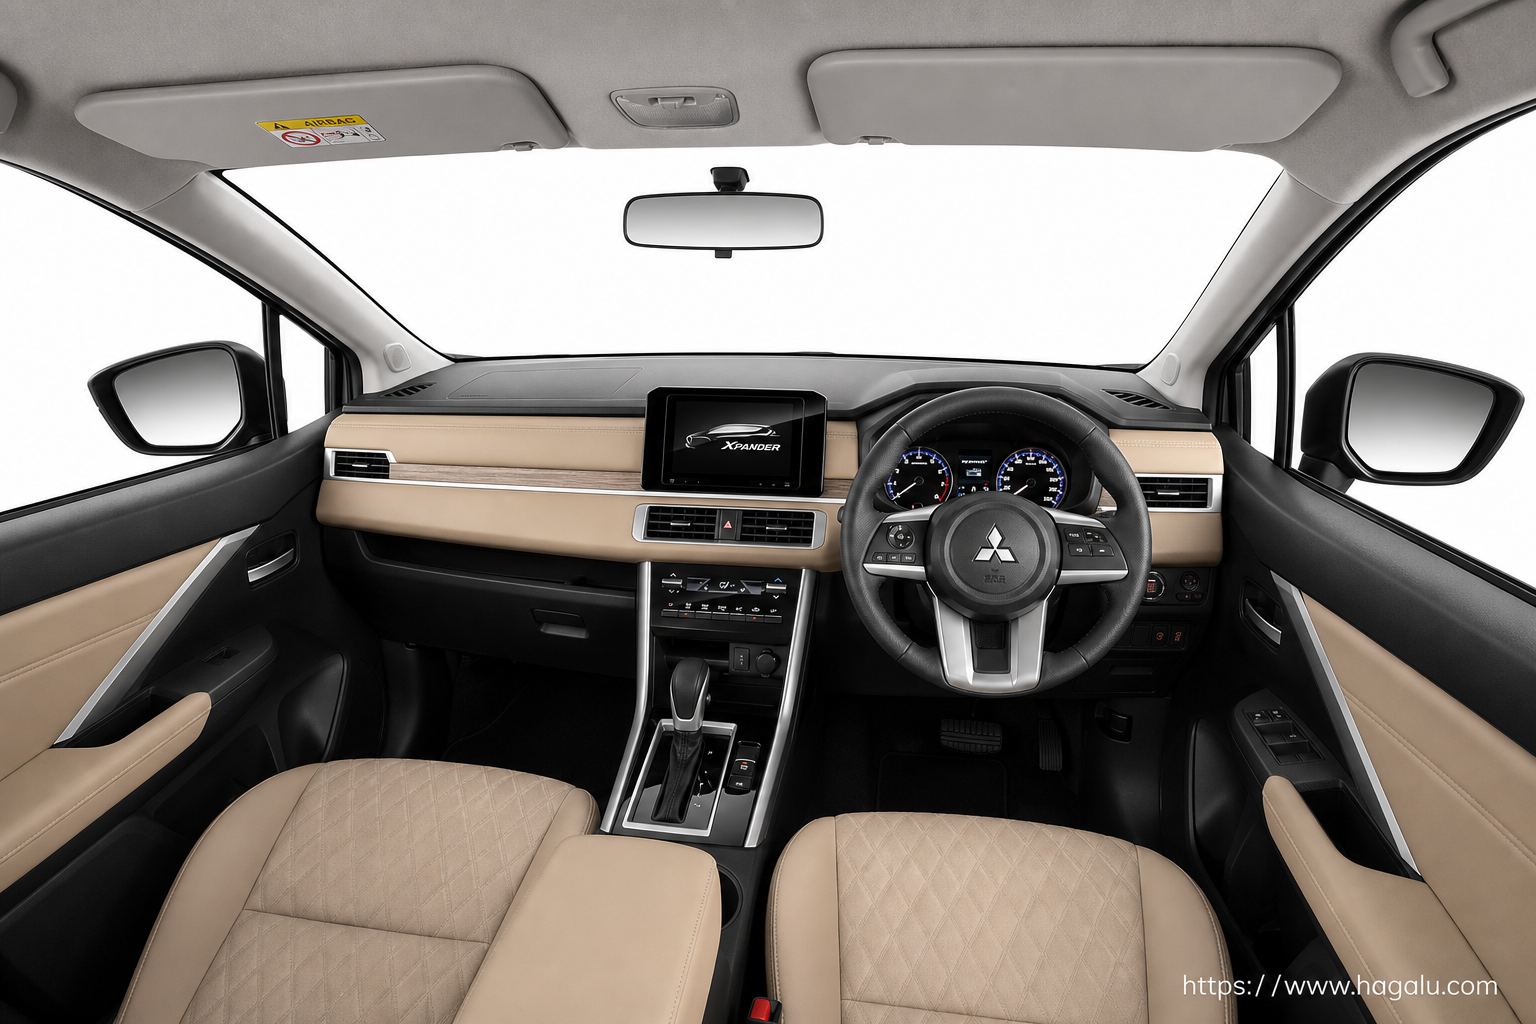
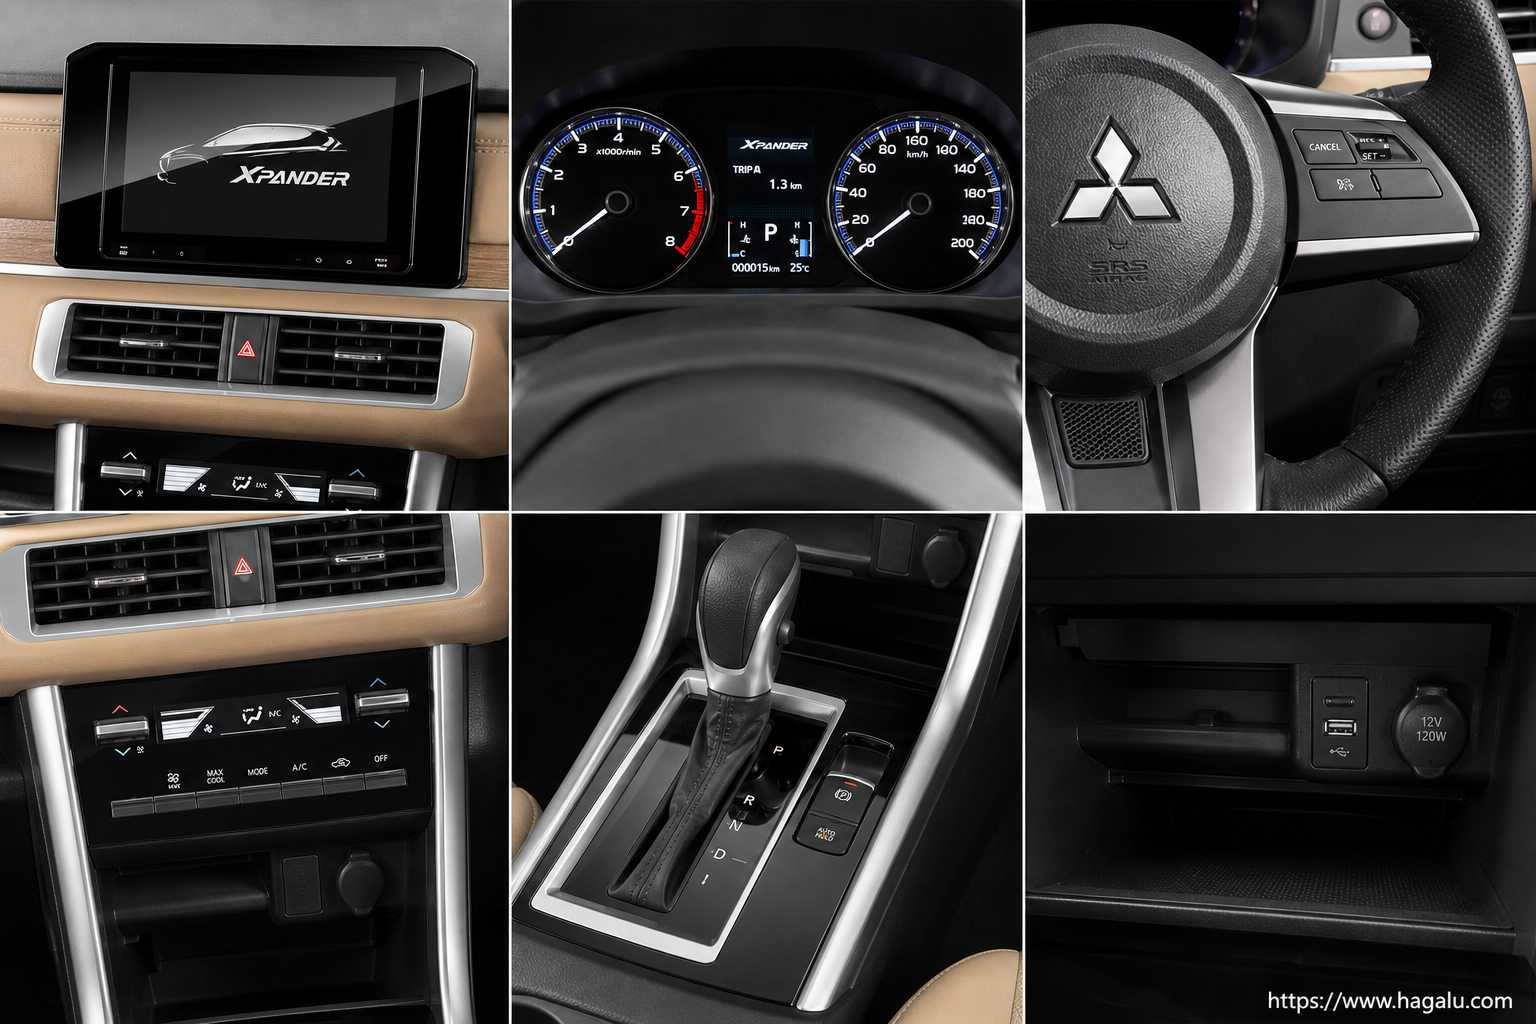
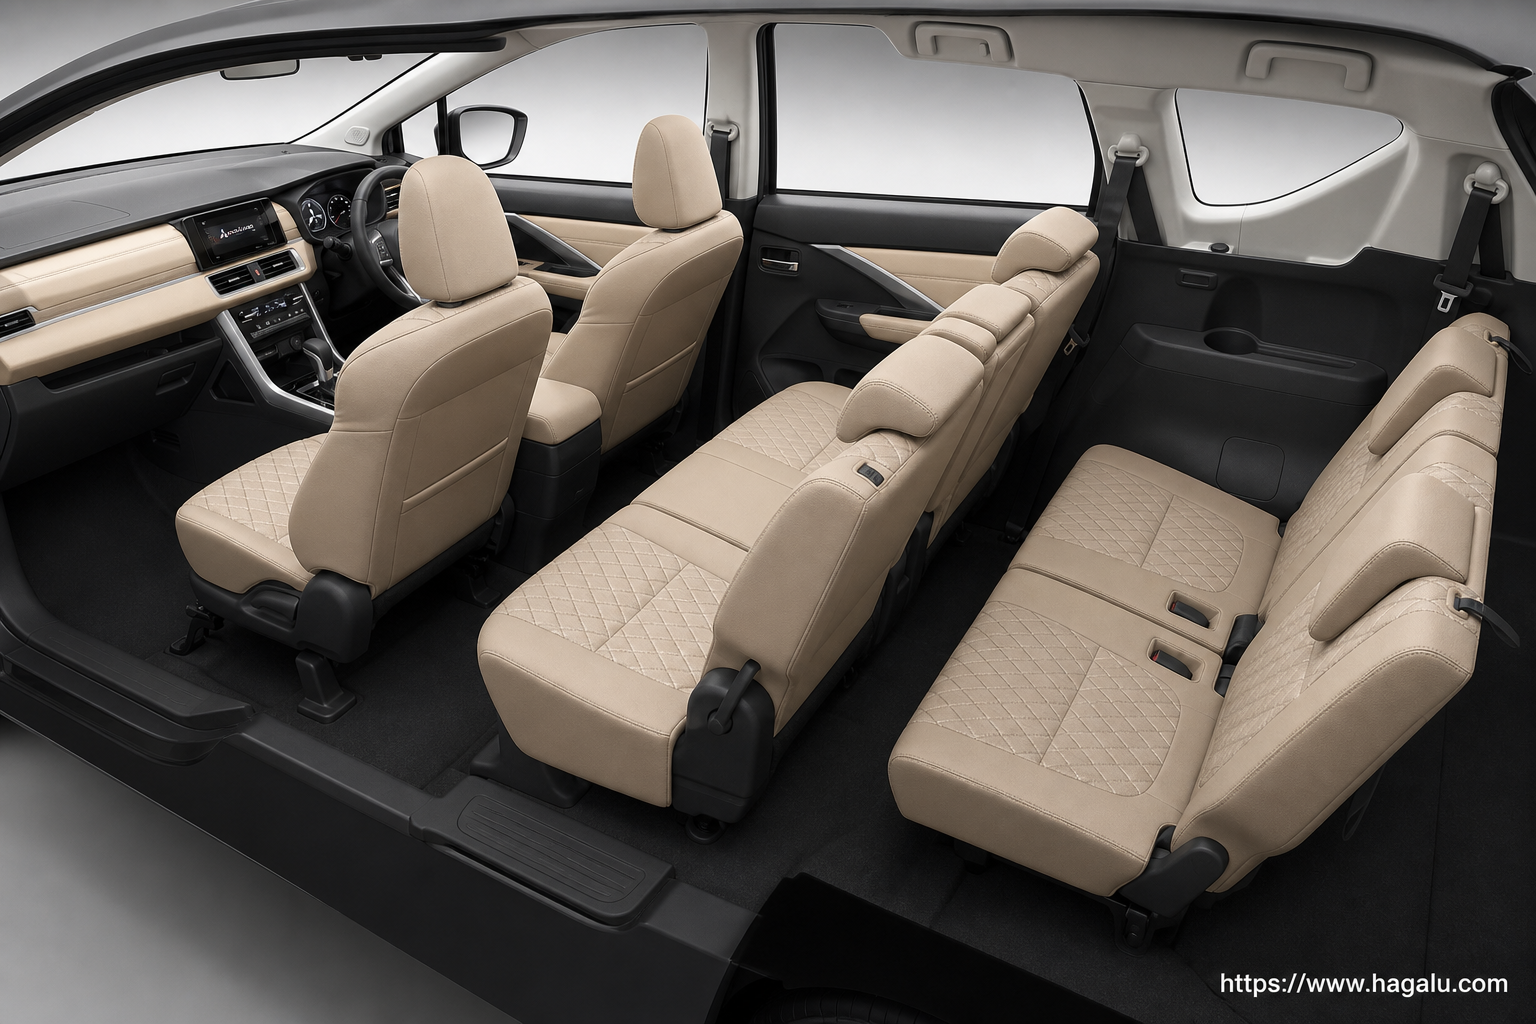
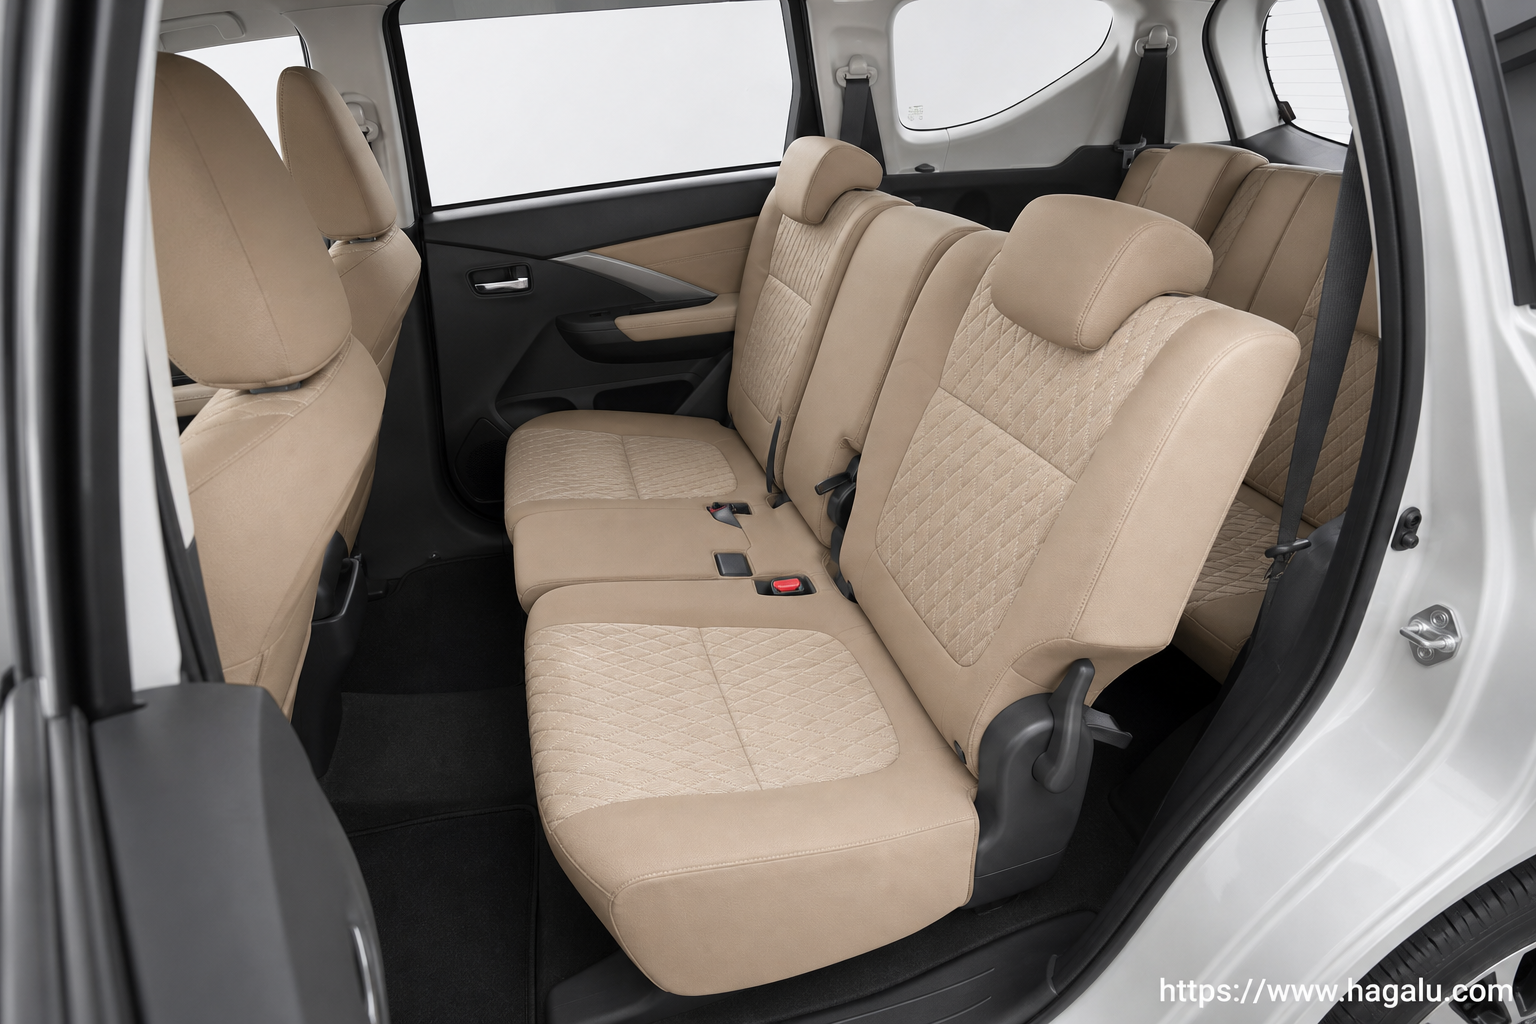
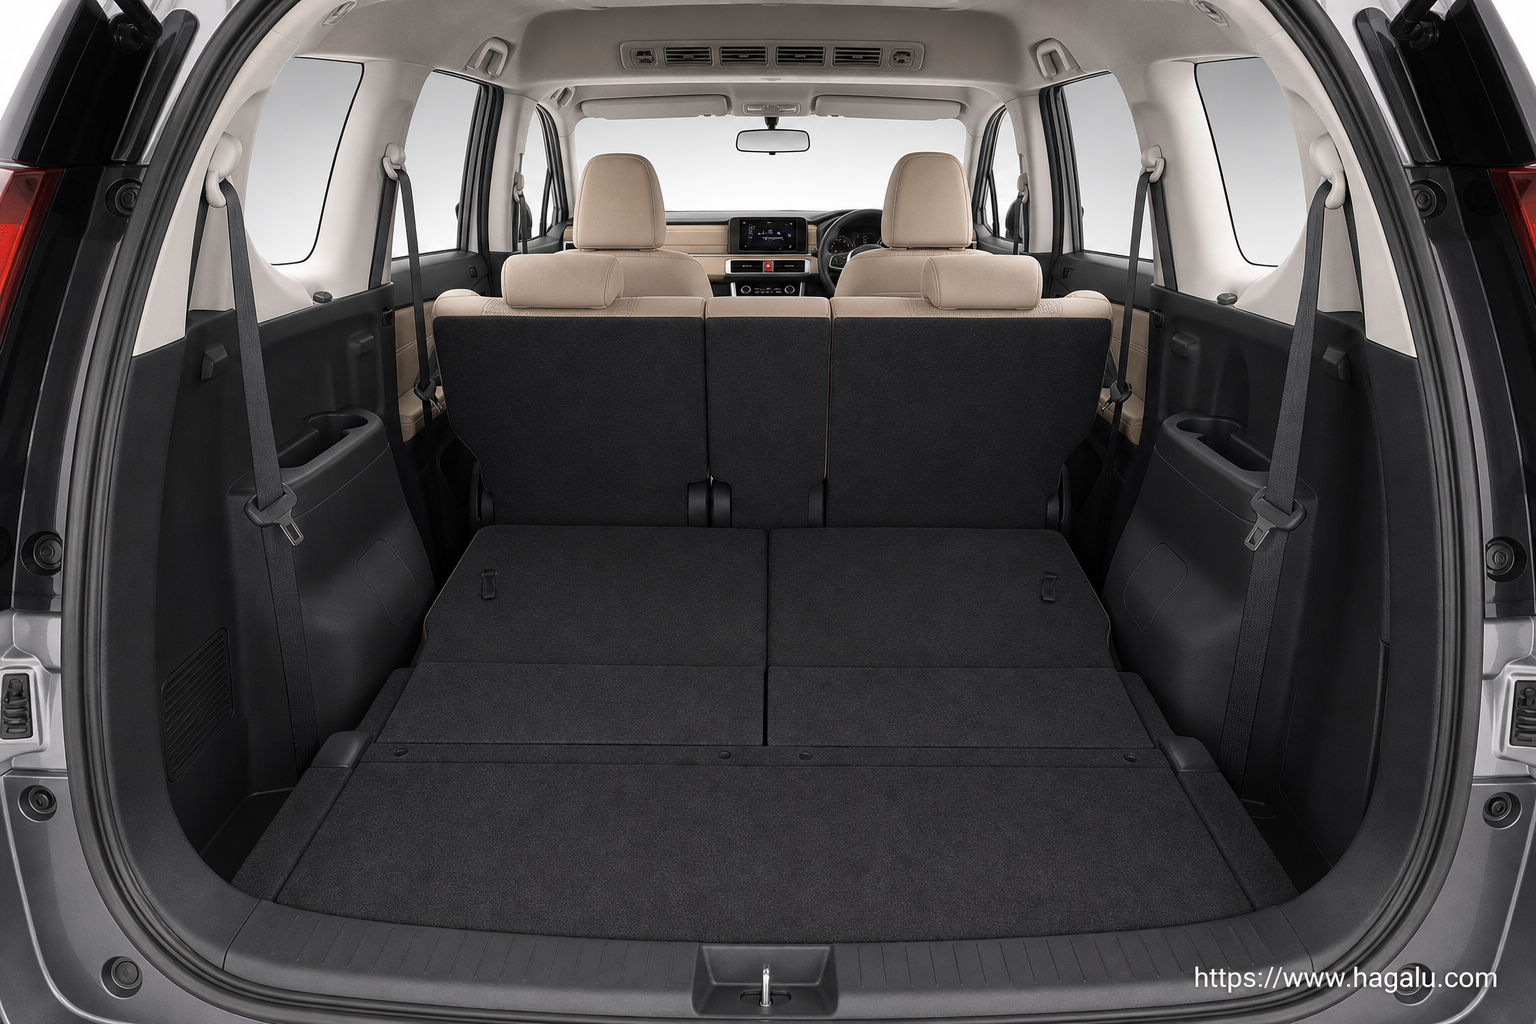
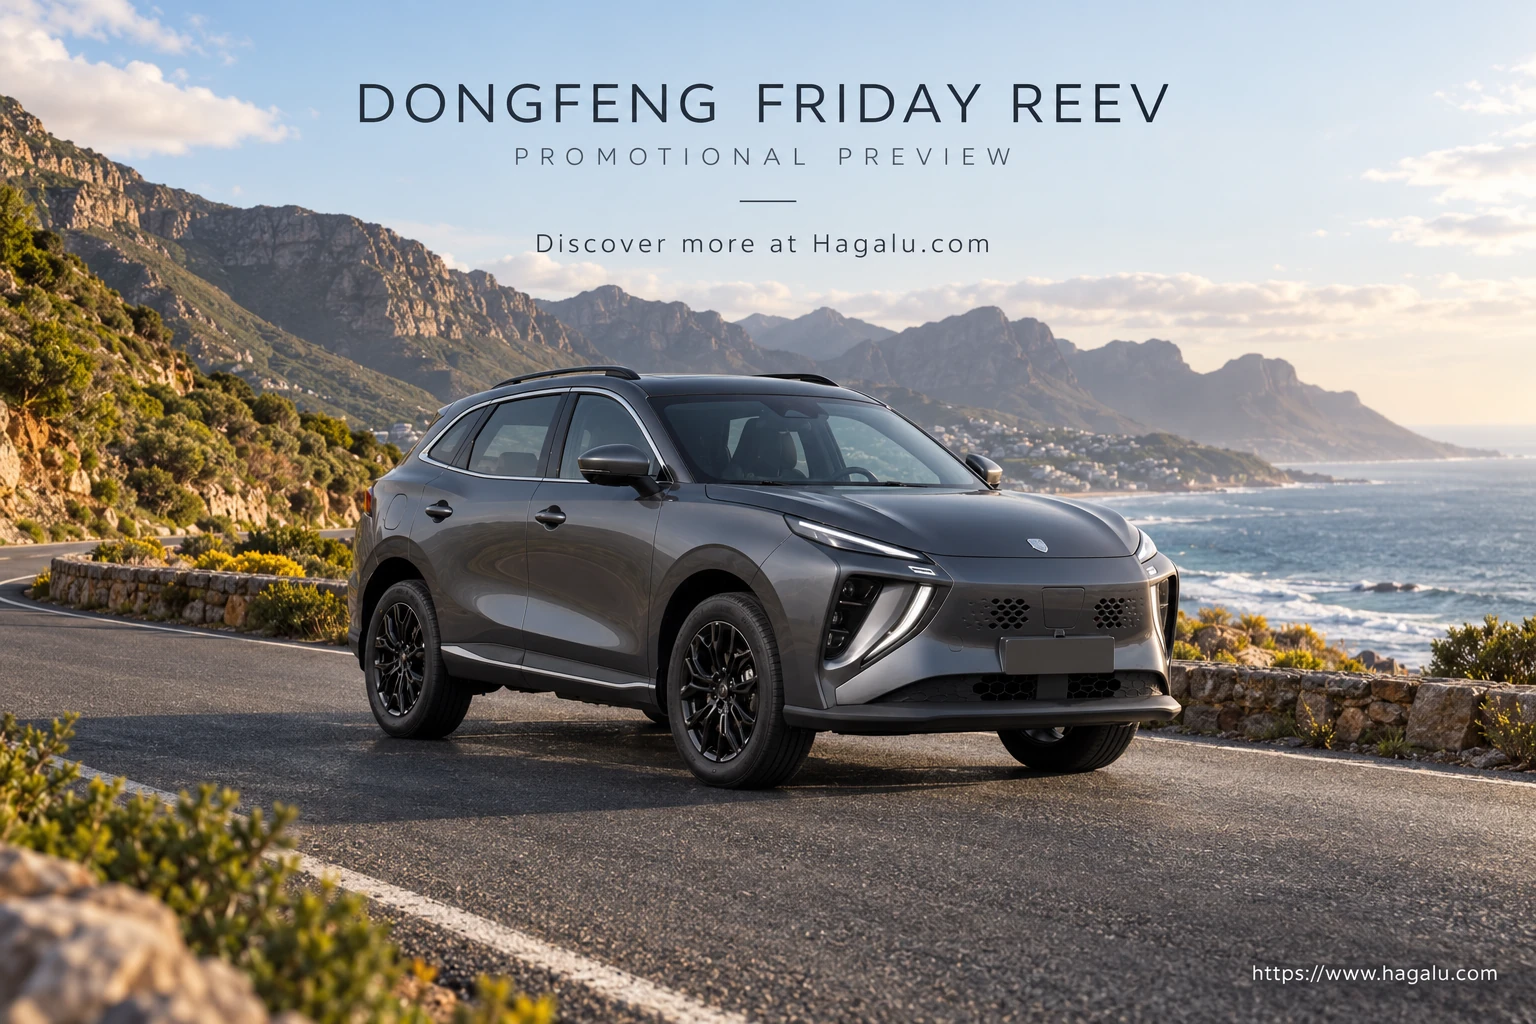
Model imagery
T2 and Xpander image comparison
Open an image for its full canonical file or visit the model page for the complete vehicle record.
Specification Evidence Index
A transparent comparison of published catalogue fields. This is not a road-test score, owner rating or editorial review rating, and it appears only when every vehicle clears the same comparable-data threshold.
Evidence / 100
Evidence-index readout
T2 leads by 25 points
T2 has a large lead in Hagalu's source-backed catalogue index over Xpander.
Evidence leader
73
/100
Lead
25
points
Data
67%
source coverage
73
#1
Evidence leader
T2
67% source coverage
3 strong categories
Best at
Safety 93
Check
Efficiency 43
Performance
77
Efficiency
43
Safety
93
Practicality
70
Leads by 25 points
48
#2
Xpander
83% source coverage
1 strong categories
Best at
Practicality 76
Check
Performance 29
Performance
29
Efficiency
56
Safety
36
Practicality
76
Performance 24%Safety 22%Practicality 22%Efficiency 17%Ownership 15%
Category leaders
What moves the verdict
Performance
T2 +48
Efficiency
Xpander +13
Safety
T2 +57
Practicality
Xpander +6
Large difference in the source-backed catalogue index.
Why this score
View full breakdown
What the evidence means
Evidence index
Jetour T2
leads the specification evidence index with 73 pts
vs 48 pts for Xpander
In Hagalu's specification evidence index, T2 leads. However, Xpander may suit buyers prioritising different confirmed fields. Ultimately, the right choice depends on your driving priorities in South Africa.
T2 vs Xpander questions
Which is better — T2 or Xpander?
+
There is no universal winner. Use the comparison table to match the models and available derivatives in South Africa on price, safety equipment, space, powertrain and ownership cover. The category indicators summarise published catalogue data; they are not a road test or customer rating.
Which is more fuel-efficient — T2 or Xpander?
+
Compare the published consumption or mileage rows for the exact derivatives using the same unit and test basis. A catalogue figure is useful for like-for-like comparison, but traffic, speed, load, weather and driving style can change actual fuel use.
Which is the safer car — T2 or Xpander?
+
Compare only equipment explicitly listed for each derivative, including airbags, stability control and driver-assistance systems. Confirm the exact trim with the manufacturer, and treat any independent crash-test result separately because equipment and ratings can differ by market.
Which is cheaper to own over five years?
+
A reliable five-year total cannot be calculated from catalogue data alone. Add the exact purchase and finance cost, fuel or electricity, insurance quotes, scheduled servicing, tyres and expected resale value. Check whether the selected derivative includes a service or maintenance plan.
Which is the better family car — T2 or Xpander?
+
Use the seating, boot or load-space, ISOFIX and safety rows as a first check. Then test the exact cars with your child seats, passengers and typical luggage, because published dimensions do not show every access or comfort difference.
Which has more engine performance — T2 or Xpander?
+
Compare the published power, torque and 0–100 km/h rows when they are available for both exact derivatives. Vehicle weight, gearing and power delivery also matter, so catalogue outputs alone do not establish real-world overtaking or response.