Honda Elevate
1.5 Comfort Manual
Read this variant's specsOne car drinks less per kilometre. Another travels farther per litre. Those are two ways of describing the same thing—until a test cycle or an uncounted battery charge changes the comparison.
Start hereMore kilometres from one litre is better; fewer litres for the same distance is better.
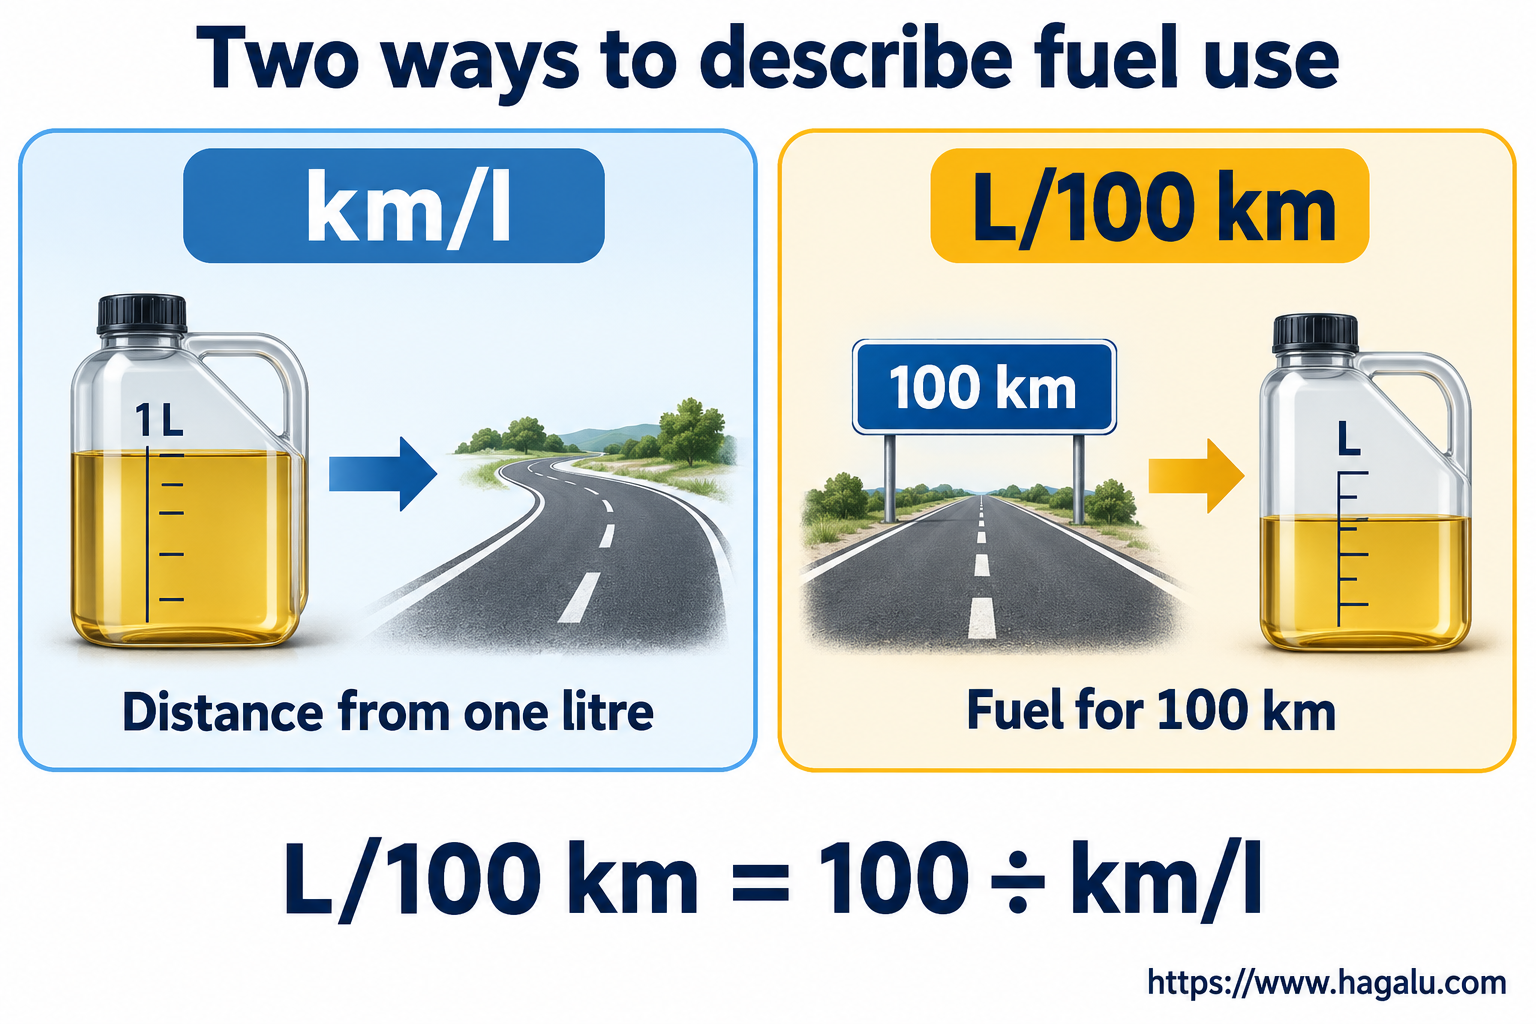
The two measures are reciprocals: L/100 km = 100 ÷ km/L, and km/L = 100 ÷ L/100 km. An illustrative 20 km/L is 5 L/100 km. A rise from 10 to 20 km/L halves fuel use per distance; a rise from 20 to 30 km/L does not halve it again.
MPG adds another trap: a US gallon and an Imperial gallon are different volumes. Identify the gallon convention before converting. Keep the source's units and rounding; extra decimal places do not make a measurement more accurate.
| Measure | Better direction | Illustrative equivalent |
|---|---|---|
| km/L | Higher | 20 km/L |
| L/100 km | Lower | 5 L/100 km |
| Fuel for 400 km | Lower for the same trip | 20 L at that assumed consumption |
Start hereCount what went into the tank and how far the car went, not the number of bars on the fuel gauge.
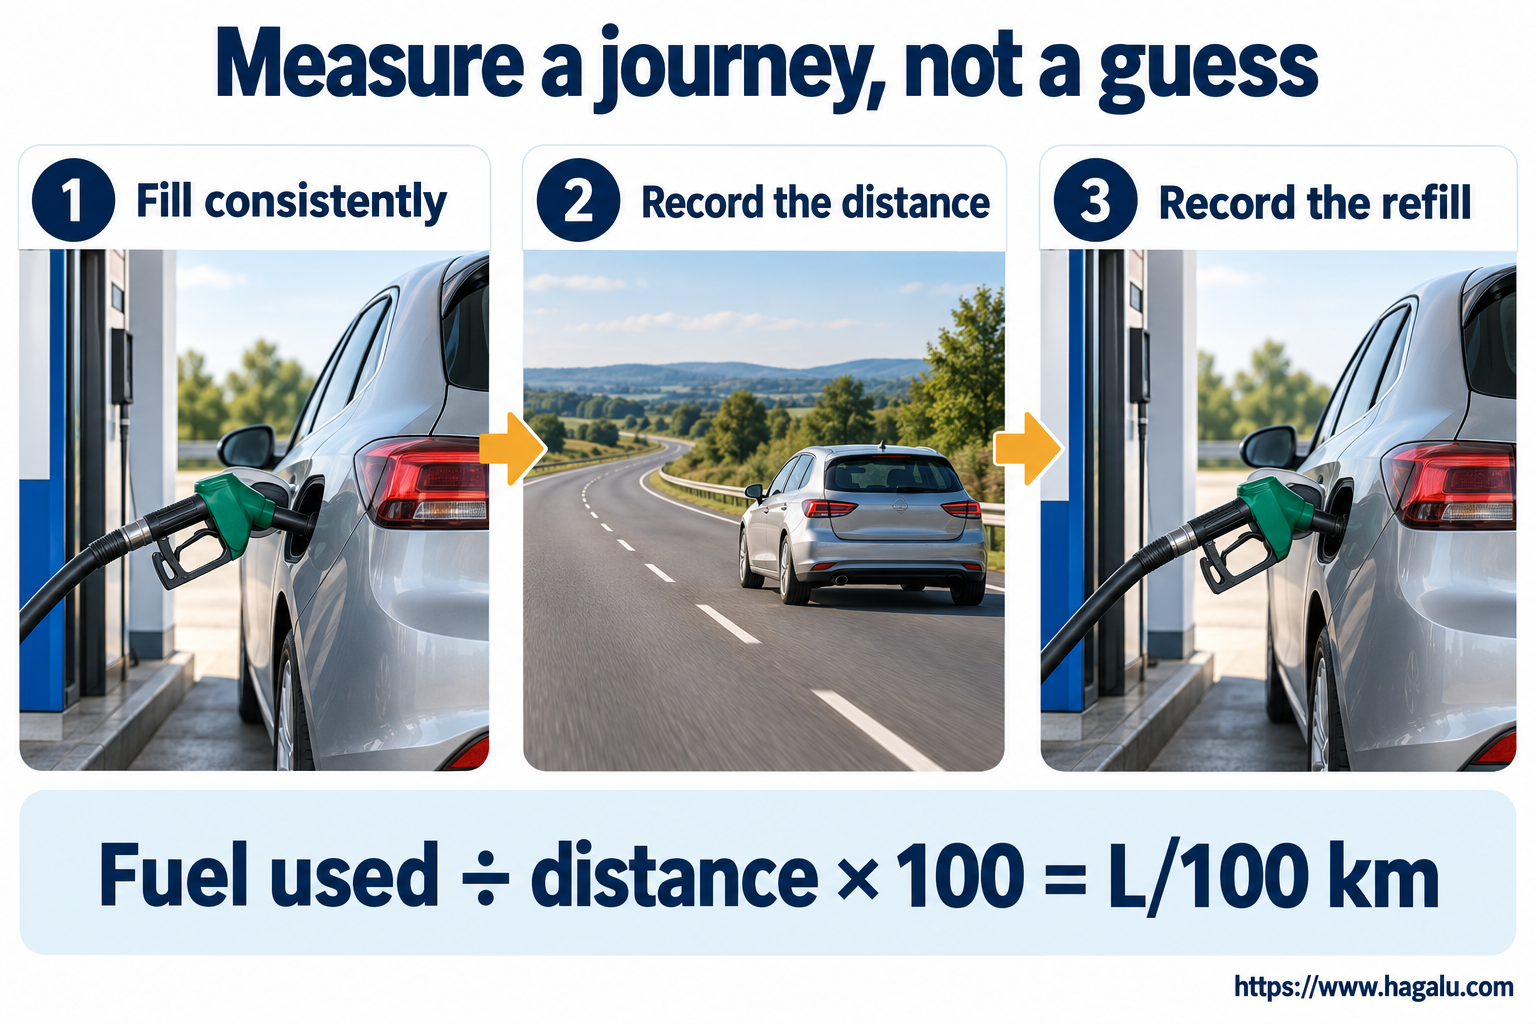
For a repeatable full-to-full record, note the odometer at a normal automatic pump shutoff, then record the litres needed at a comparable later refill. Do not overfill. Litres divided by kilometres, multiplied by 100, gives L/100 km. For example, 32 L over 500 km is 6.4 L/100 km.
One short refill is noisy: pump shutoff, vehicle angle and the starting level can differ. Several consecutive fills improve the record. Keep route, load, weather and driving style in the notes. A dashboard estimate can be useful, but it is not an independent measure of purchased fuel.
Start hereThe engine is not only moving the car. It is also overcoming the road, pushing air aside and powering the things you switch on.
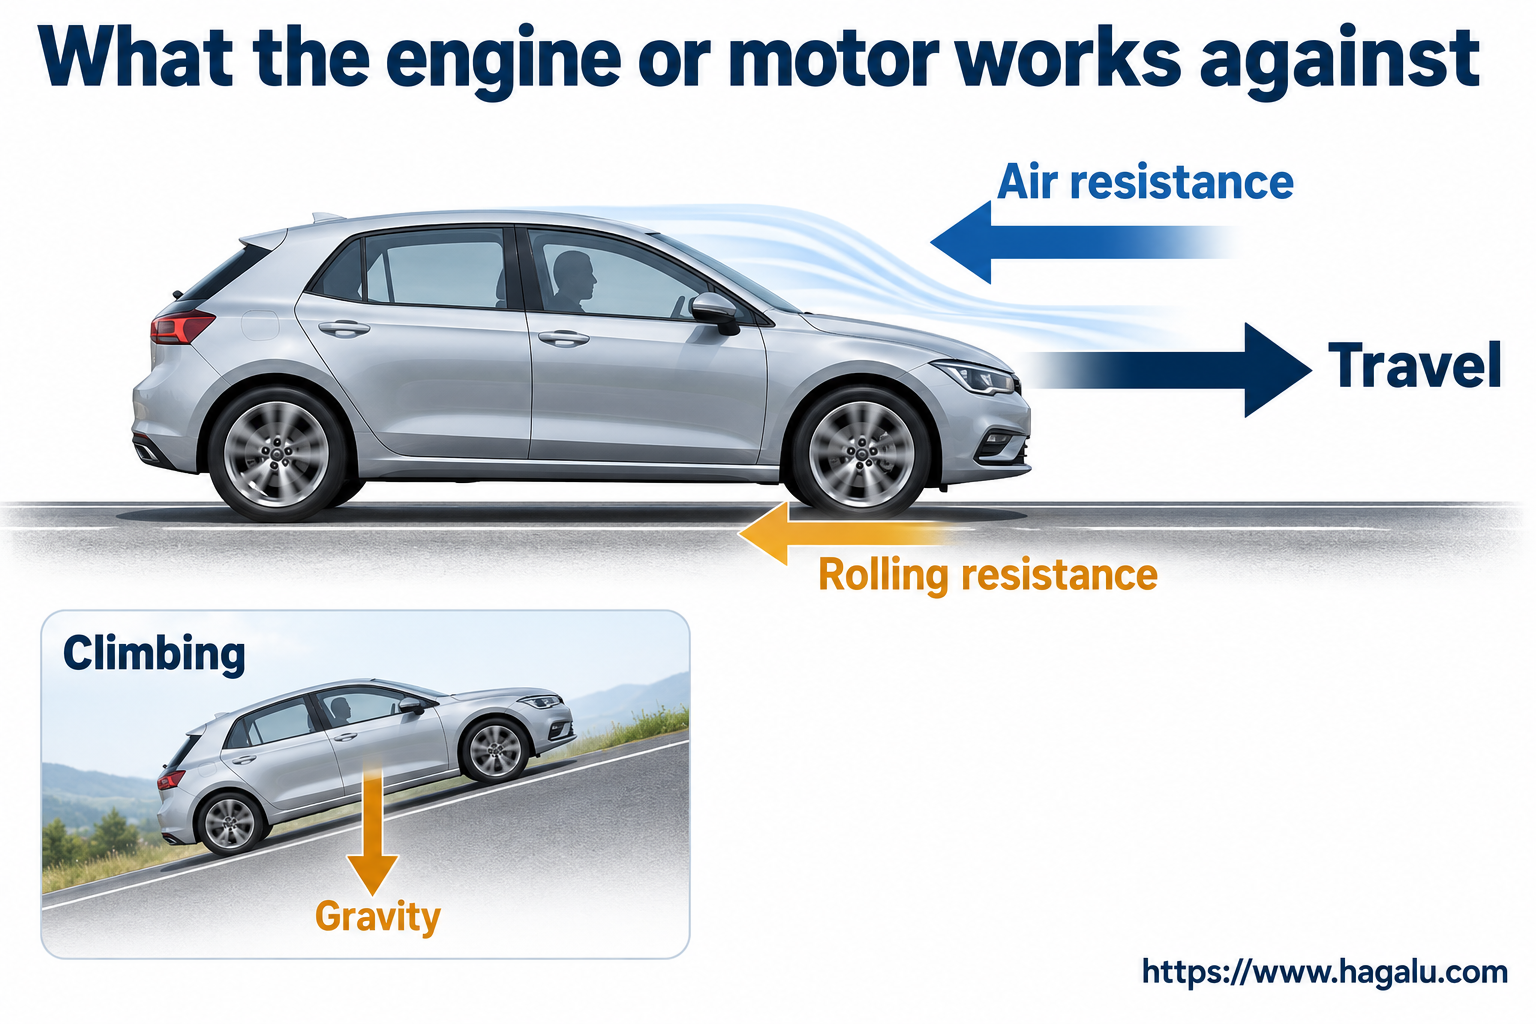
At steady speed, road demand includes rolling resistance and aerodynamic drag. A common model is Fdrag = ½ρCdAv². The power needed to overcome that drag is Fdrag × v, so its speed dependence is stronger than the force's. A roof load can alter both frontal area and airflow.
Climbing adds gravitational potential energy; acceleration adds kinetic energy. Braking usually dissipates some energy as heat, while a hybrid or EV can recover part through regeneration. Cold operation and cabin conditioning can change consumption. None of these effects has a single percentage that applies to every car and journey.
Start hereTwo cars running the same test can be compared more fairly, but your road is not the test track.
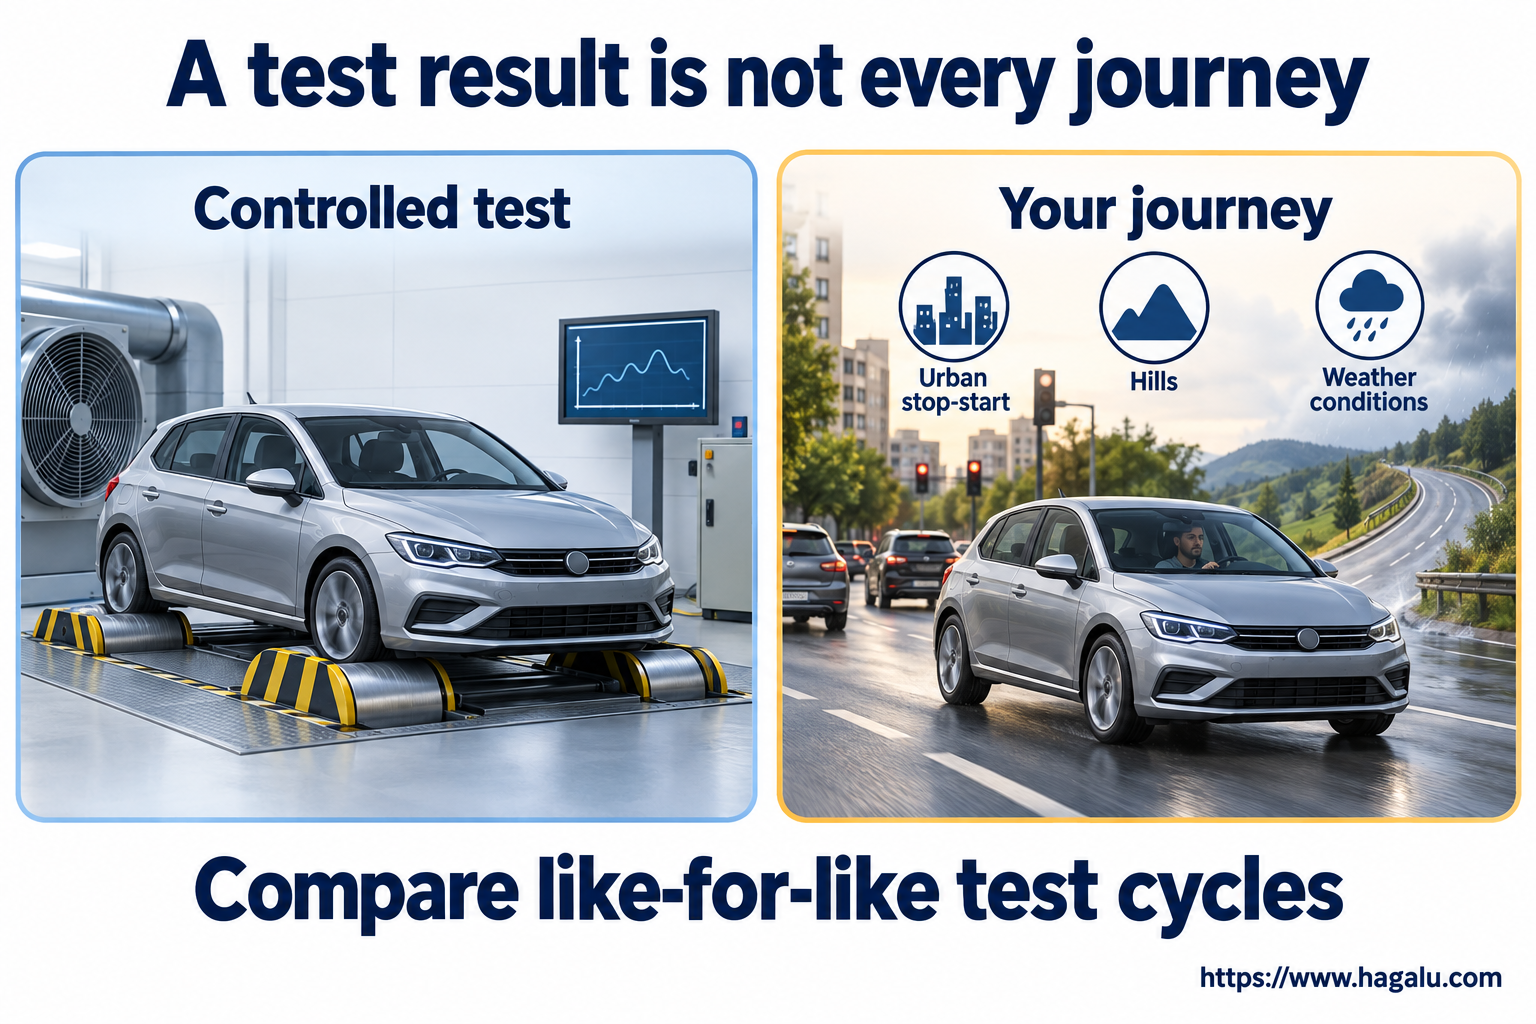
A driving cycle defines a speed-and-time pattern and other conditions. The result helps compare vehicles tested on that basis. WLTP, NEDC, EPA and other protocols are not interchangeable labels; do not apply a universal multiplier to turn one into another.
Read whether a figure is city, highway, combined or weighted. 'Combined' is not necessarily a simple arithmetic average. For PHEVs, the weighted result also reflects assumptions about electric driving. A low petrol number without an electricity figure or the relevant methodology is an incomplete energy comparison.
Start hereCO2 is not the same thing as soot, and a filter does not remove every kind of emission.
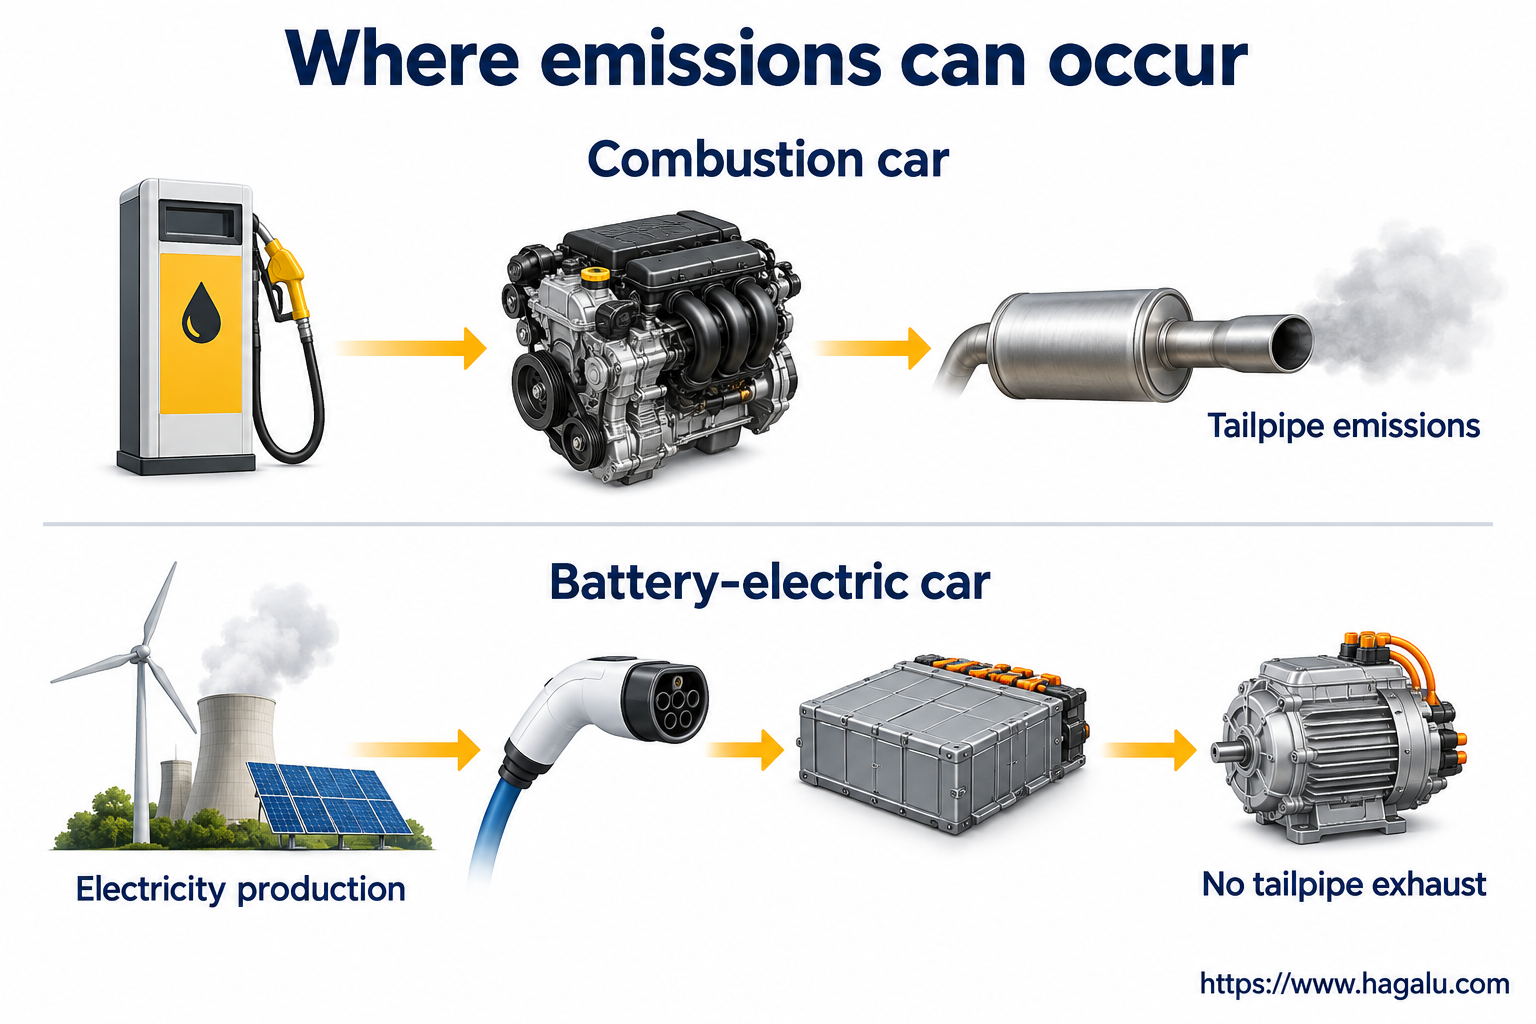
Fuel carbon produces CO2 during combustion; tailpipe CO2 per kilometre therefore relates to the fuel burned and fuel properties. NOx, carbon monoxide, hydrocarbons and particles have different formation and treatment mechanisms. A particulate filter traps particles; a catalyst or SCR system addresses other exhaust chemistry under suitable conditions.
A BEV has no combustion tailpipe emissions while driving, but electricity production, manufacturing, tyres and brakes still matter to a wider assessment. State whether a comparison is tailpipe, energy-supply or life-cycle. An emissions standard, a laboratory CO2 rating and a complete environmental assessment are not the same claim.
Start hereA journey using electricity and petrol has two inputs, even when the petrol gauge hardly moves.
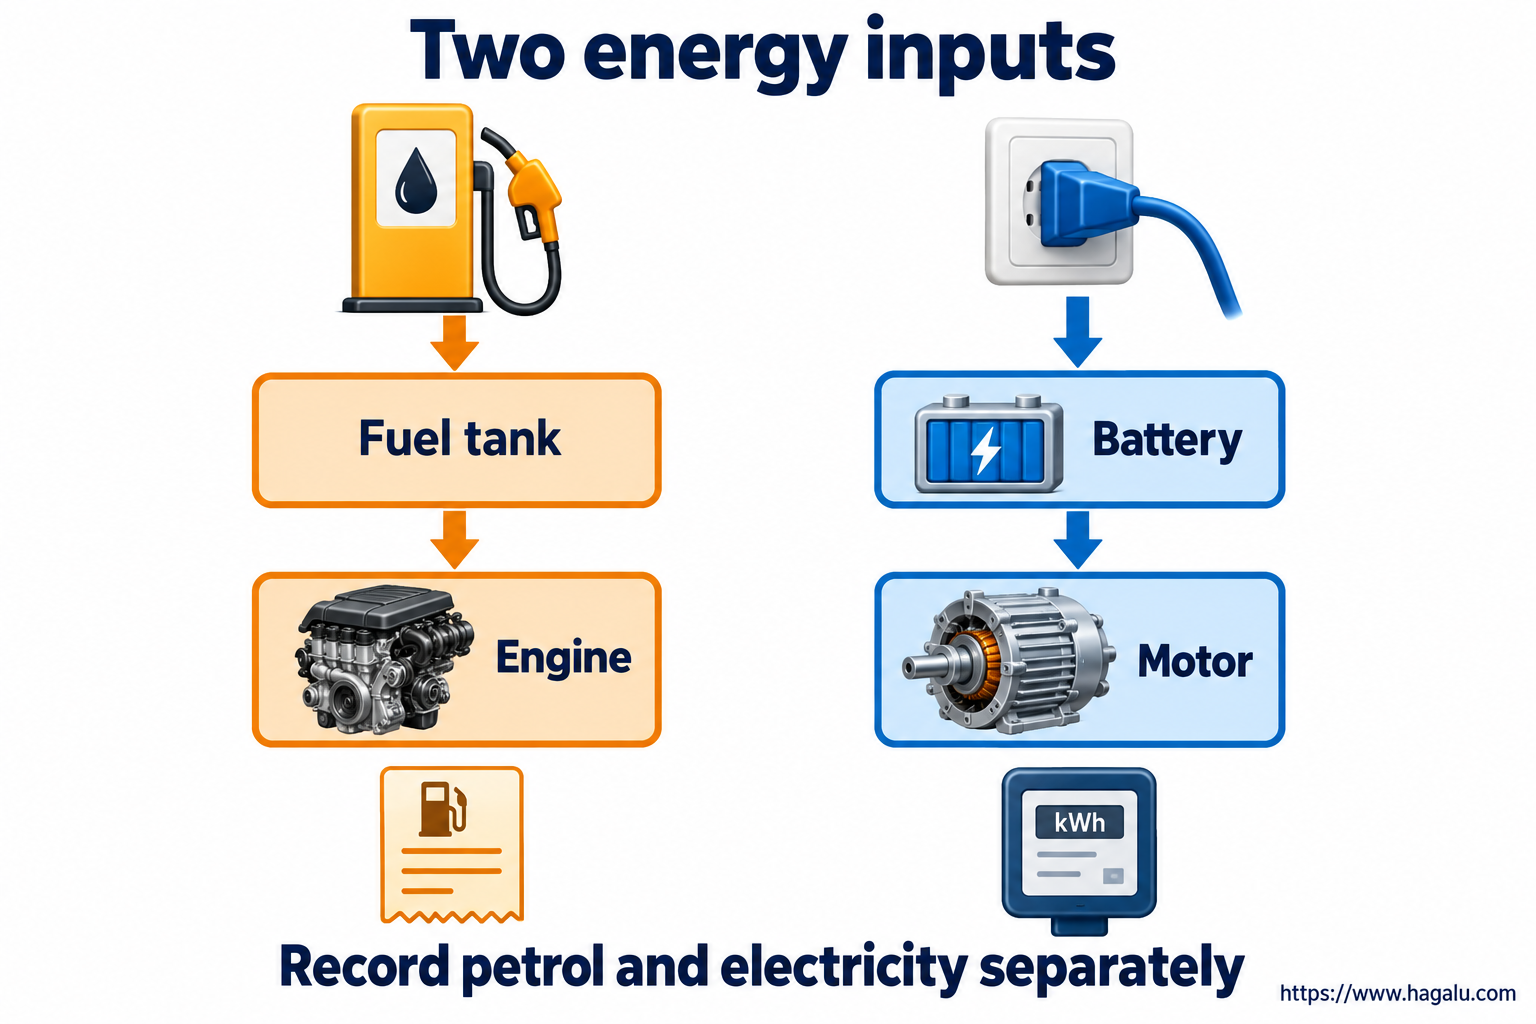
Add fuel purchased and wall electricity purchased over the same distance, with comparable starting and finishing battery levels. Illustrative inputs of 2 L and 10 kWh per 100 km at 20 currency units/L and 3 currency units/kWh cost 40 + 30 = 70 currency units. This is not a local tariff or a model rating.
A wall meter includes charging losses and possibly other loads; a dashboard energy reading can use a different boundary. For a fair comparison, identify both. Do not count purchase costs, insurance or servicing inside 'fuel consumption', but do include them when comparing total ownership costs.
This is educational context, not an OEM service procedure. Use current instructions for the exact vehicle and market before measurements, repairs or safety-critical work.
These links rotate within your selected country. Open an exact variant to check its recorded specifications; the teaching diagrams above do not represent these models.
1.5 Comfort Manual
Read this variant's specsLuxury
Read this variant's specsGhost Extended Series II
Read this variant's specsPanel Van MT
Read this variant's specsDivide 100 by the km/L value. For example, 20 km/L equals 5 L/100 km. The input must be positive and use kilometres and litres.
Your speed, traffic, load, terrain, weather and operating conditions can differ from the published test. Compare the exact derivative and measurement basis.
Not to calculate consumption for combined journeys. Add the litres and distance first, then divide; equal-distance consumption comparisons are easiest in L/100 km.
No. CO2 and pollutants such as NOx and particles describe different things and are controlled differently.
Not by itself. You must account for externally purchased electricity and the starting and ending battery state.
These references support the principles, not the specifications of every car. Regional manuals and test protocols have their own scope; never transfer one vehicle's limits or legal rules to another.
All numerical examples in this guide are labelled illustrations. Technical images simplify the mechanism; they are original Hagalu teaching artwork, not manufacturer-approved parts drawings.