A proper head-to-head in South Africa — compare price, performance,
fuel economy or electric range, safety and the details that shape long-term ownership.
Kiger and Triber are close on the comparable published fields, so buyer priorities should decide.
Triber starts ZAR 1,000 cheaperKiger from ZAR 219,999 · Triber from ZAR 218,999
Five key differences
Exact selected derivatives
Swipe sideways to compare every column
Specification
Kiger
Triber
Maximum Power
Kiger52 kW @ 6250 rpm
Triber53 kW @ 6250 rpm
Maximum Torque
Kiger96 Nm
Triber96 Nm @ 3500 rpm
Engine Size
Kiger999 cc
Triber999 cc
Combined Fuel Economy
Kiger18.9 km/l
Triber18.2 km/l
Ground Clearance
Kiger205 mm
Triber182 mm
Strongest published figure in that row; no road-test winner is implied.
Independent editorial assessment
Hagalu editorial ratings
When a variant is selected, its rating out of five applies only to that exact derivative; a model-range review is not inherited. Editorial ratings are separate from the Specification Evidence Index out of 100 and are not customer ratings.
Renault Kiger
Naturally Aspirated MT Evolution
Hagalu editorial ratingNot yet rated
No complete editorial rating is published for this exact variant. This is not a zero score.
Not yet rated means a complete review is not published; it does not mean the vehicle scored zero. Read the rating methodology.
What Each Car Gets Right (and Wrong)
Kiger
Strengths
Better fuel efficiency
Weak Spots
Lower published practicality figures
Best suited to:Published Efficiency
Specification evidence leader
Triber
Strengths
Stronger published practicality figures
Weak Spots
Lower fuel efficiency
Best suited to:Published Practicality
Which One's Right for You?
Kiger
Buyers prioritising the lower published fuel or energy use
Triber
Buyers prioritising the stronger published space and capacity figures
Full Specs, Side by Side
Open a category, then swipe sideways to compare every column
Spec
Kiger
Triber
Model Introduced Year
2026
2026
Generation
Current South Africa Kiger range
Current South Africa Triber range
Facelift History
Current South Africa version listed by official source
Current South Africa version listed by official source
Facelift Launched Since
2026
2026
Facelift Version Ending
Current
Current
Body Style
SUV
MPV
Model Year
2026
2026
Production Status
active
active
Segment
SUV
MPV
Tare Mass Kg
911 kg
926 kg
Vehicle Type
SUV
MPV
Spec
Kiger
Triber
Length
3990 mm
3985 mm
Width
1605 mm
1935 mm
Height
1605 mm
1643 mm
Wheelbase
2500 mm
2636 mm
Ground Clearance (Default)
205 mm
182 mm
Ground Clearance (With Full Seating Load)
205 mm
182 mm
Fuel Tank Capacity
40 l
40 l
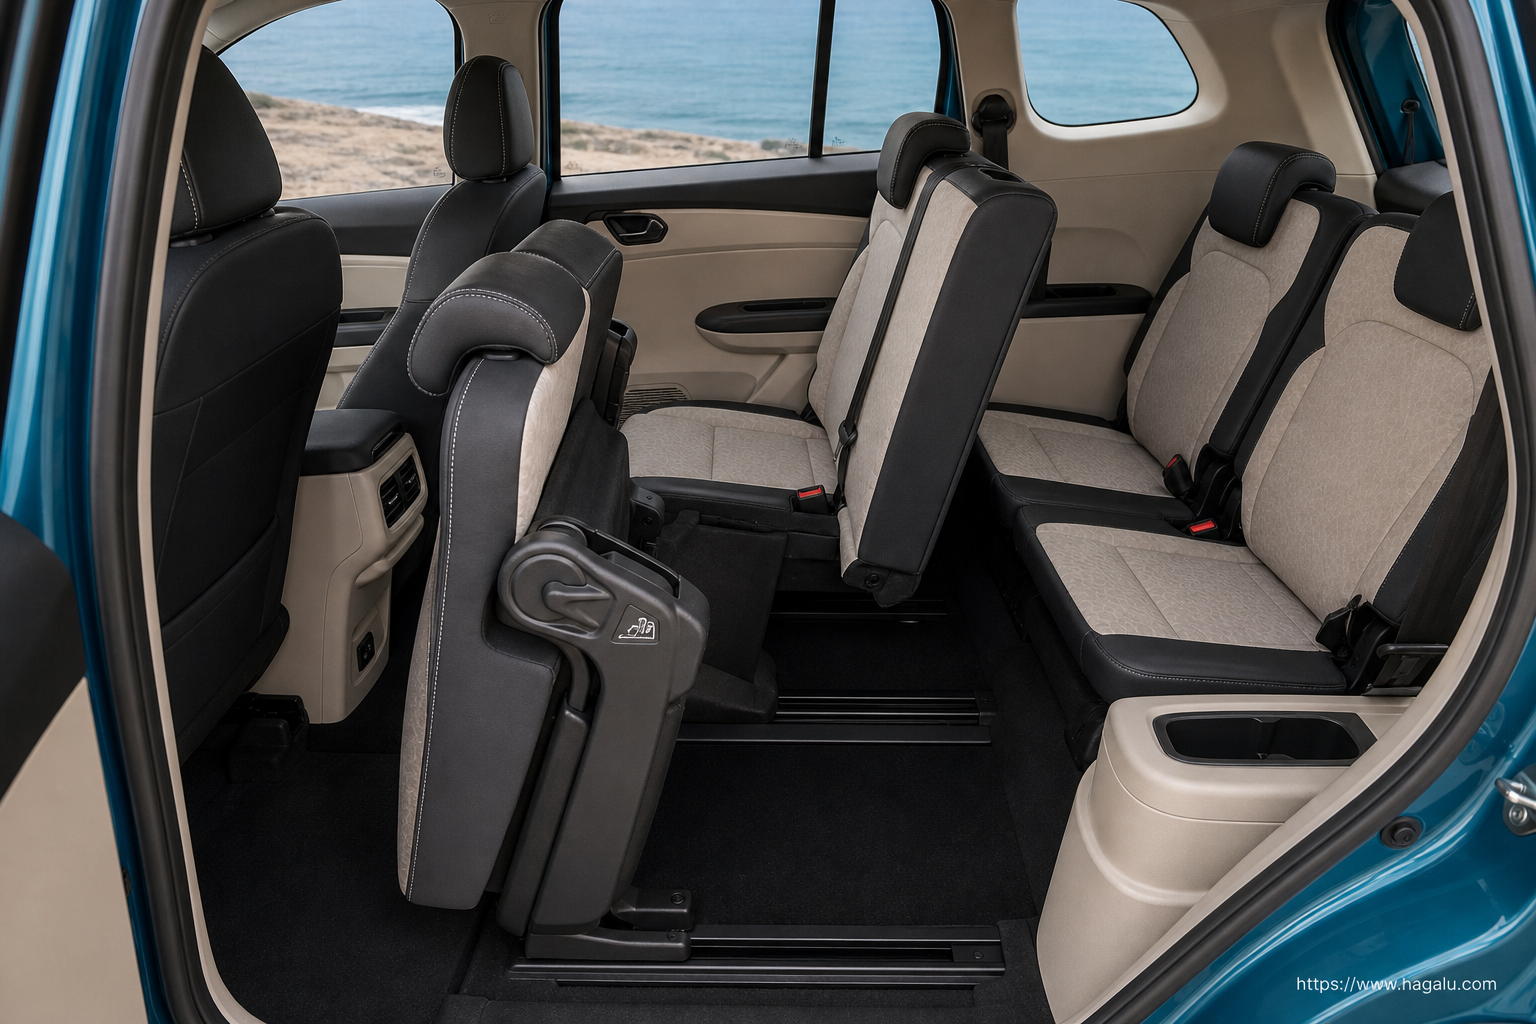
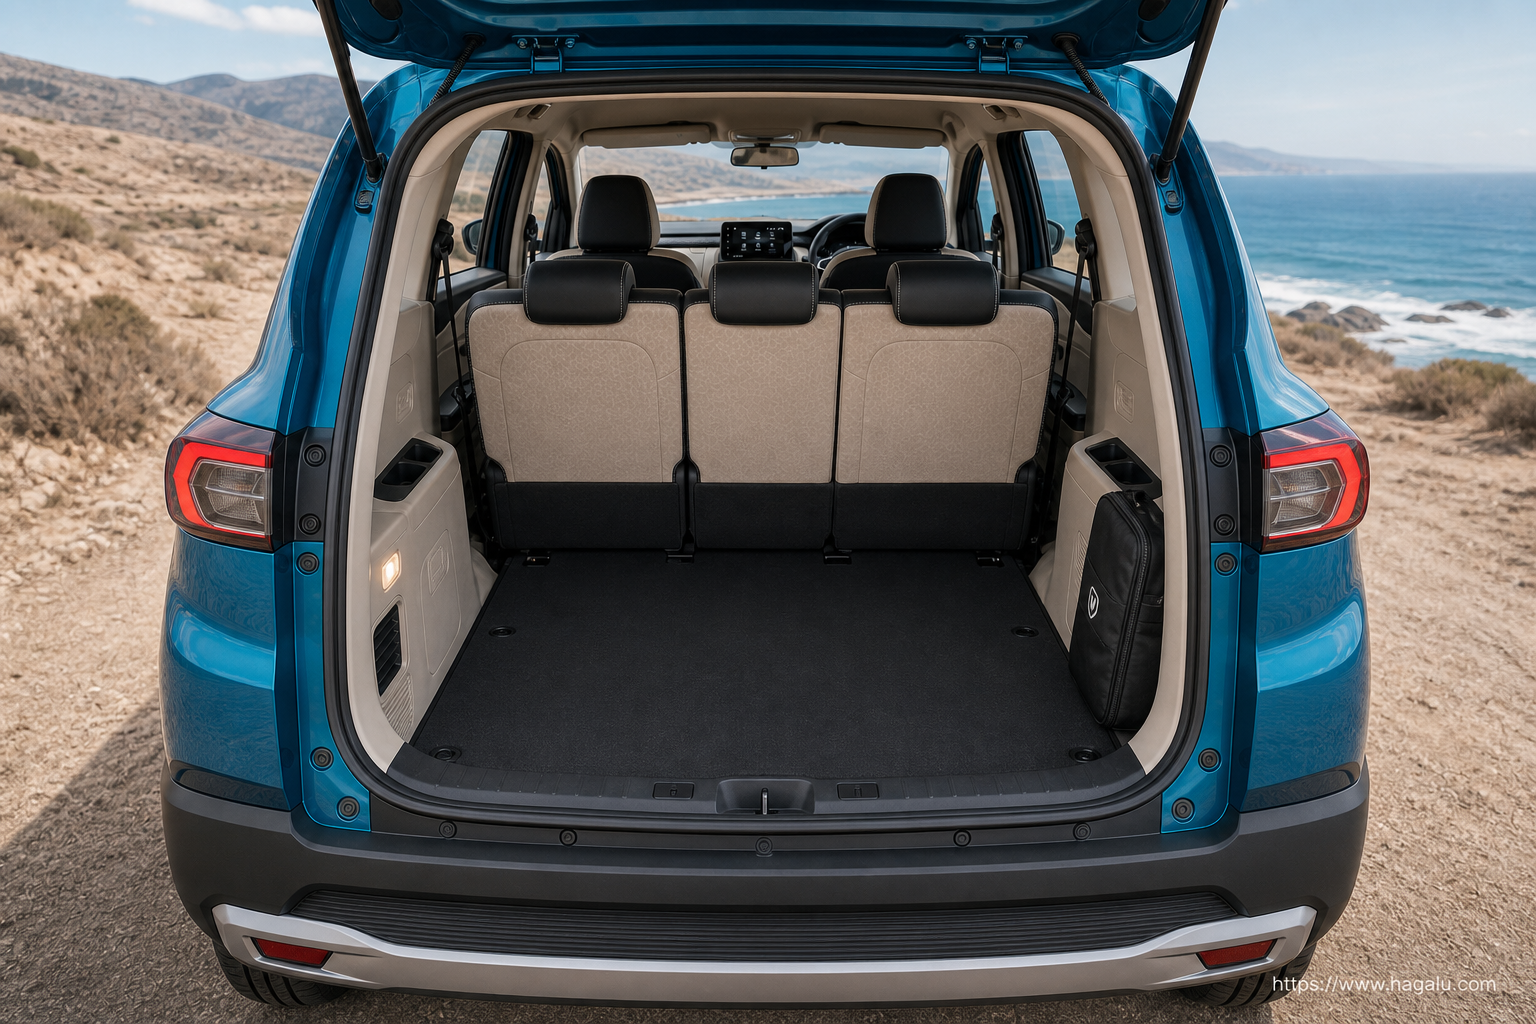
Boot/Cargo Space
405 l
625 l
Kerb Weight
911 kg
926 kg
Gross Vehicle Weight (GVW)
1373 kg
1522 kg
Payload Capacity
462 kg
596 kg
Towing Capacity
0 kg
0 kg
Seating Capacity
5 seats
7 seats
Number of Rows
2 rows
3 rows
Doors
5 doors
5 doors
Minimum Turning Radius
5.02 m
5.0 m
Front Headroom
1010 mm
970 mm
Rear Headroom
975 mm
1060 mm
Front Legroom
1015 mm
1028 mm
Rear Legroom
900 mm
930 mm
Spec
Kiger
Triber
Front Track Width
Not Available
Not Available
Rear Track Width
Not Available
Not Available
Front Suspension
MacPherson strut
MacPherson strut
Rear Suspension
Not Available
Not Available
Spec
Kiger
Triber
Load Bed Length
Not Applicable
Not Applicable
Load Bed Width
Not Applicable
Not Applicable
Climate Control
Manual / automatic by trim
Manual / automatic by trim
Power Windows
Standard
Standard
Keyless Entry
Standard
Standard
Push Button Start
Standard
Standard
Wireless Charging
Not Available
Not Available
Sunroof
Not Available
Not Available
Electric Tailgate
Not Available
Not Available
Rain Sensing Wipers
Not Available
Not Available
Boot Space Seats Folded
Not Available
625 l
AC Type
Manual / automatic by trim
Manual / automatic by trim
Loadbox Length Mm
Not Applicable
Not Applicable
Loadbox Width Mm
Not Applicable
Not Applicable
Spec
Kiger
Triber
Engine
1-litre Naturally Aspirated Petrol
1-litre Naturally Aspirated Petrol
Engine Code
Not Officially Disclosed
Not Officially Disclosed
Fuel Type
Petrol
Petrol
Hybrid System
Not Applicable
Not Applicable
Engine Displacement
999 cc
999 cc
Cylinders
3
3
Cylinder Layout
Inline
Inline
Valves
12
12
Valves per Cylinder
4
4
Aspiration
Naturally Aspirated
Naturally Aspirated
Fuel System
Petrol injection
Petrol injection
Compression Ratio
Not Officially Disclosed
Not Officially Disclosed
Bore
Not Officially Disclosed
Not Officially Disclosed
Stroke
Not Officially Disclosed
Not Officially Disclosed
Maximum Power
52 kW @ 6250 rpm
53 kW @ 6250 rpm
Maximum Torque
96 Nm
96 Nm @ 3500 rpm
Combined Power
Not Applicable
Not Applicable
Combined Torque
Not Applicable
Not Applicable
Motor Type
Not Applicable
Not Applicable
Number of Motors
Not Applicable
Not Applicable
Motor Location
Not Applicable
Not Applicable
Drive Type
FWD
FWD
Transmission
5-Speed Manual
5-Speed Manual
Top Speed
Not Officially Disclosed
Not Officially Disclosed
0-100 km/h
Not Officially Disclosed
Not Officially Disclosed
Quarter Mile
Not Officially Disclosed
Not Officially Disclosed
Drive Modes
Eco, Normal, Sport
Eco, Normal, Sport
Launch Control
Not Officially Disclosed
Not Officially Disclosed
Rev Limiter
Not Officially Disclosed
Not Officially Disclosed
Power-to-Weight Ratio
Not Officially Disclosed
Not Officially Disclosed
Torque-to-Weight Ratio
Not Officially Disclosed
Not Officially Disclosed
Battery Capacity
Not Applicable
Not Applicable
Usable Battery Capacity
Not Applicable
Not Applicable
Battery Type
Not Applicable
Not Applicable
Battery Voltage
Not Applicable
Not Applicable
Electric Range
Not Applicable
Not Applicable
AC Charging Power
Not Applicable
Not Applicable
DC Charging Power
Not Applicable
Not Applicable
AC Charging Time
Not Applicable
Not Applicable
DC Charging Time
Not Applicable
Not Applicable
Regenerative Braking
Not Applicable
Not Applicable
Spec
Kiger
Triber
Gearbox
Manual
Manual
Drivetrain Layout
FWD
FWD
LSD Available
Not Applicable
Not Applicable
Transfer Case
Not Applicable
Not Applicable
Differential Lock
Not Applicable
Not Applicable
Paddle Shifters
Not Applicable
Not Applicable
Final Drive Ratio
Not Applicable
Not Applicable
Number of Gears
Not Available
Not Available
Transmission Type
Manual
Manual
Clutch Type
Manual clutch
Manual clutch
Gear Shift Indicator
Standard
Standard
Gear Shift Type
Manual
Manual
Drivetrain
FWD
FWD
4WD Engagement
Not Applicable
Not Applicable
4WD Hi Range
Not Applicable
Not Applicable
4WD Lo Range
Not Applicable
Not Applicable
4WD Selector
Not Applicable
Not Applicable
Automatic Shift Paddles
Not Applicable
Not Applicable
Front Differential Lock
Not Applicable
Not Applicable
Gearbox Type
Manual
Manual
Low Range Ratio
Not Applicable
Not Applicable
Low Range
Not Applicable
Not Applicable
Axle Layout
FWD
FWD
Rear Differential Lock
Not Applicable
Not Applicable
Transmission Speeds
Not Available
Not Available
Spec
Kiger
Triber
Claimed Mileage
18.9 km/l
18.2 km/l
City Mileage
15.2 km/l
14.5 km/l
Highway Mileage
22.2 km/l
21.3 km/l
Fuel Tank Capacity
40 l
40 l
Emission Standard
Euro VIb
Euro VIb
AdBlue Tank Capacity
Not Applicable
Not Applicable
Auto Start Stop
Not Available
Not Available
Real-world Mileage
18.9 km/l
18.2 km/l
Charging Port Type
Not Applicable
Not Applicable
Charging Type
Not Applicable
Not Applicable
Fuel Tank Litres
40
40
Combined Driving Range
Not Applicable
Not Applicable
Electric Consumption
Not Applicable
Not Applicable
Range Real World Highway
Not Applicable
Not Applicable
Range Real World Mixed
Not Applicable
Not Applicable
Spec
Kiger
Triber
Airbags
Front airbags
Front airbags
ABS
Standard
Standard
Electronic Stability Control
Standard
Standard
Traction Control
Standard
Standard
Hill Descent Control
Standard
Not Available
Hill Start Assist
Standard
Standard
Child Safety Lock
Standard
Standard
ISOFIX Mounts
Standard
Standard
Brake Assist
Standard
Standard
Tyre Pressure Monitor
Standard
Standard
Engine Immobiliser
Standard
Standard
Seatbelt Warning All Seats
Standard
Standard
Front Parking Sensors
Not Available
Not Available
AEB
Not Available
Not Available
BA
Standard
Standard
Brake Override System
Standard
Standard
Curtain Airbags
Standard
Standard
Driver Airbag
Standard
Standard
EBD
Standard
Standard
Engine Immobiliser
Standard
Standard
Hill Hold
Standard
Standard
Passenger Airbag
Standard
Standard
Rear Cross Traffic Alert
Not Available
Not Available
Seatbelt Pretensioners
Standard
Standard
Seatbelt Reminder
Standard
Standard
Side Airbags
Standard
Standard
Stability Control
Standard
Standard
TCS
Standard
Standard
Knee Airbag
Not Available
Not Available
ABS EBD
Standard
Standard
Spec
Kiger
Triber
Cruise Control
Standard
Standard
Adaptive Cruise Control
Not Available
Not Available
Lane Keep Assist
Not Available
Not Available
Lane Departure Warning
Not Available
Not Available
Blind Spot Monitoring
Not Available
Not Available
Rear Cross Traffic Alert
Not Available
Not Available
Parking Sensors
Standard
Standard
Rear View Camera
Standard
Standard
360 Degree Camera
Not Available
Not Available
Autonomous Emergency Braking
Not Available
Not Available
Driver Fatigue Alert
Not Available
Not Available
Traffic Sign Recognition
Not Available
Not Available
Auto Highbeam
Not Available
Not Available
Auto Wipers
Not Available
Not Available
Rear Parking Sensors
Standard
Standard
Reverse Camera
Standard
Standard
Adaptive Cruise Control
Not Available
Not Available
Park Assist
Not Available
Not Available
Around View Monitor
Not Available
Not Available
Blind Spot Warning
Not Available
Not Available
Forward Collision Warning
Not Available
Not Available
Spec
Kiger
Triber
Seat Material
Fabric or cloth trim
Fabric or cloth trim
Heated Seats
Not Available
Not Available
Ventilated Seats
Not Available
Not Available
Ambient Lighting
Not Available
Not Available
Front Shoulder Room
Not Available
Not Available
Rear Shoulder Room
Not Available
Not Available
Steering Wheel Material
Polyurethane / synthetic
Polyurethane / synthetic
60 40 Split Seat
Standard
Standard
Driver Seat Adjustment
Manual
Manual
Passenger Seat Adjustment
Manual
Manual
Seat Trim
Fabric
Fabric
Spec
Kiger
Triber
Infotainment System
Touchscreen infotainment
Touchscreen infotainment
Apple CarPlay
Standard
Standard
Android Auto
Standard
Standard
Bluetooth Connectivity
Standard
Standard
Number of Speakers
4-6
4-6
Digital Instrument Cluster
Standard
Standard
USB Ports
Front and rear USB where listed
Front and rear USB where listed
Infotainment Screen
10.25-inch or larger by trim
10.25-inch or larger by trim
Touchscreen
10.25-inch or larger by trim
10.25-inch or larger by trim
Spec
Kiger
Triber
LED Headlamps
Not Available
Not Available
Daytime Running Lamps
Standard
Standard
Fog Lamps
Not Available
Not Available
Roof Rails
Standard
Not Applicable
Exterior Colour Options
Official Renault South Africa colours vary by model and dealer stock.
Official Renault South Africa colours vary by model and dealer stock.
Headlights
Not Available
Not Available
Panoramic Sunroof
Not Available
Not Available
Spec
Kiger
Triber
Approach Angle
Not Available
Not Available
Departure Angle
Not Available
Not Available
Wading Depth
Not Available
Not Available
Terrain Modes
Not Applicable
Not Applicable
Locking Differential
Not Applicable
Not Applicable
4WD System Type
Not Applicable
Not Applicable
Breakover Angle
Not Available
Not Available
Ground Clearance Max
205 mm
182 mm
Ground Clearance Min
205 mm
182 mm
Spec
Kiger
Triber
Tyre Size
Not Available
Not Available
Front Brake Type
Ventilated Disc
Ventilated Disc
Rear Brake Type
Disc
Disc
Spare Wheel Type
Not Available
Not Available
Wheel Rim Size
Not Available
Not Available
Handbrake Type
Electronic parking brake
Electronic parking brake
Spec
Kiger
Triber
CO2 Emissions
126 g/km
131 g/km
Fuel Octane Requirement
Petrol
Petrol
Spec
Kiger
Triber
Service Plan
2 year / 30 000 km
2 year / 30 000 km
Spec
Kiger
Triber
Ownership Role
entry-value
entry-value
Price Zar
219999 ZAR
218999 ZAR
Pricing Role
entry-value
entry-value
Starting Price
219999
218999
Starting Price Zar
219999
218999
Spec
Kiger
Triber
Warranty
5 Year / 150 000 km
5 Year / 150 000 km
In depth: how these cars differ
This Kiger and Triber comparison uses the exact derivatives selected above for South Africa. The catalogue index covers performance, efficiency, safety equipment, practicality and ownership cover only where comparable source-backed fields are present.
Performance index: Kiger 27 vs Triber 27.
Efficiency index: Kiger 71 vs Triber 69.
Safety-equipment index: Kiger 91 vs Triber 91.
Practicality index: Kiger 65 vs Triber 83.
Ownership-cover index: Kiger not separately scored vs Triber not separately scored.
These figures are Hagalu catalogue-comparison indicators, not customer ratings, crash-test scores, resale guarantees or a substitute for a road test. Each page shows its weighted source coverage beside the result.
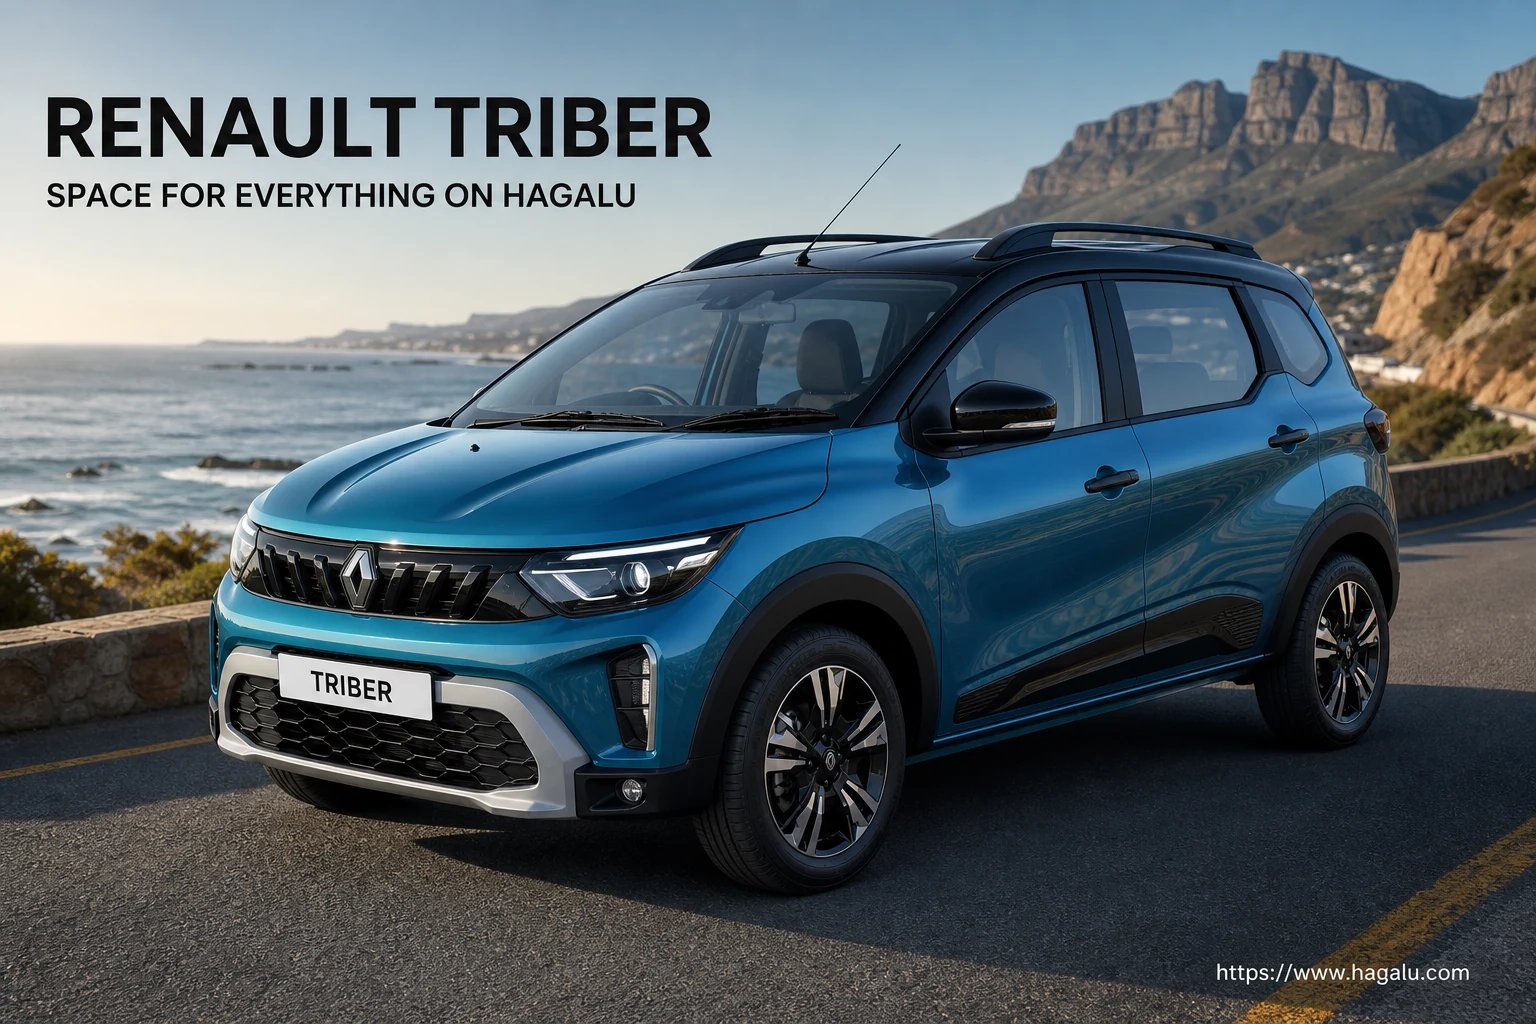
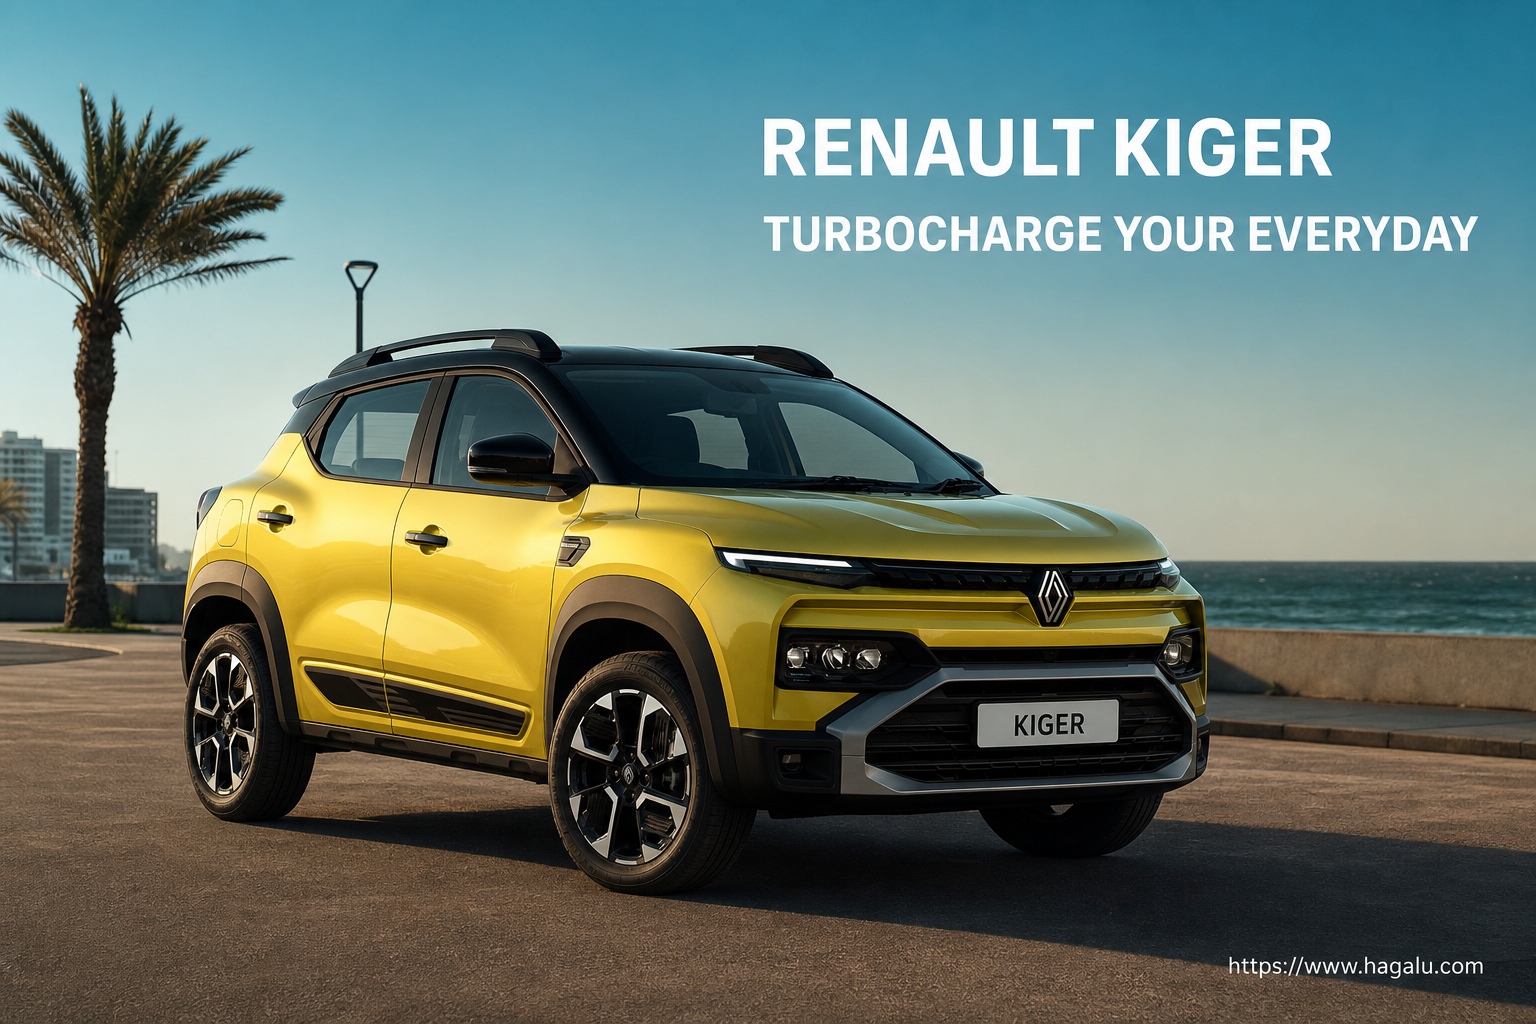
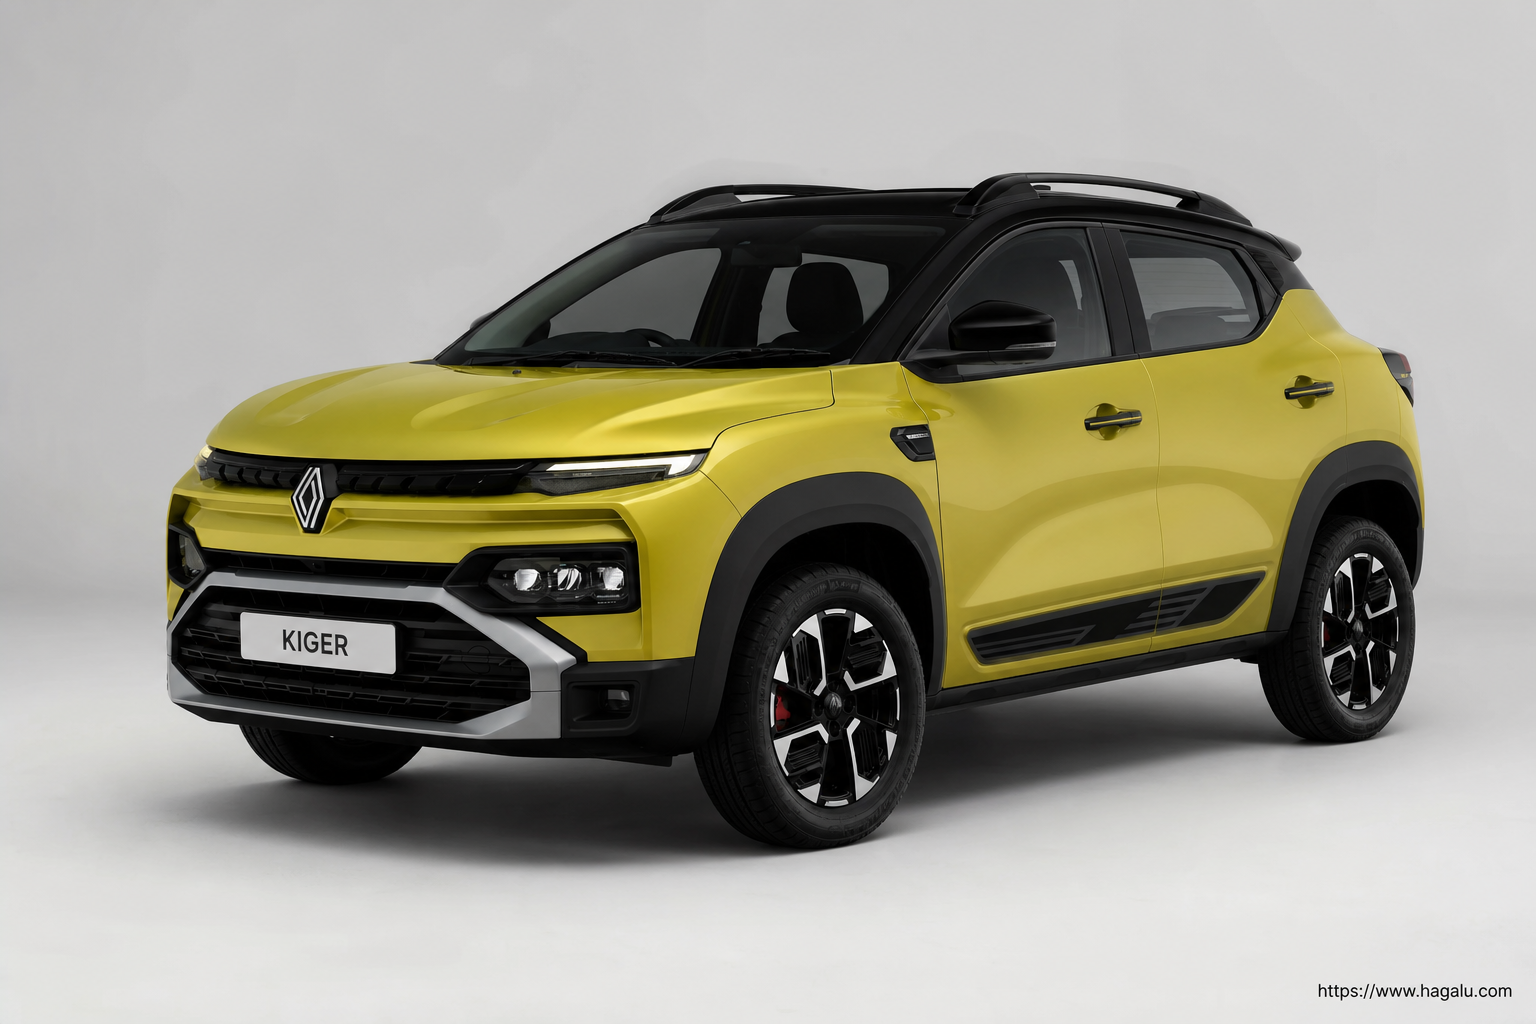
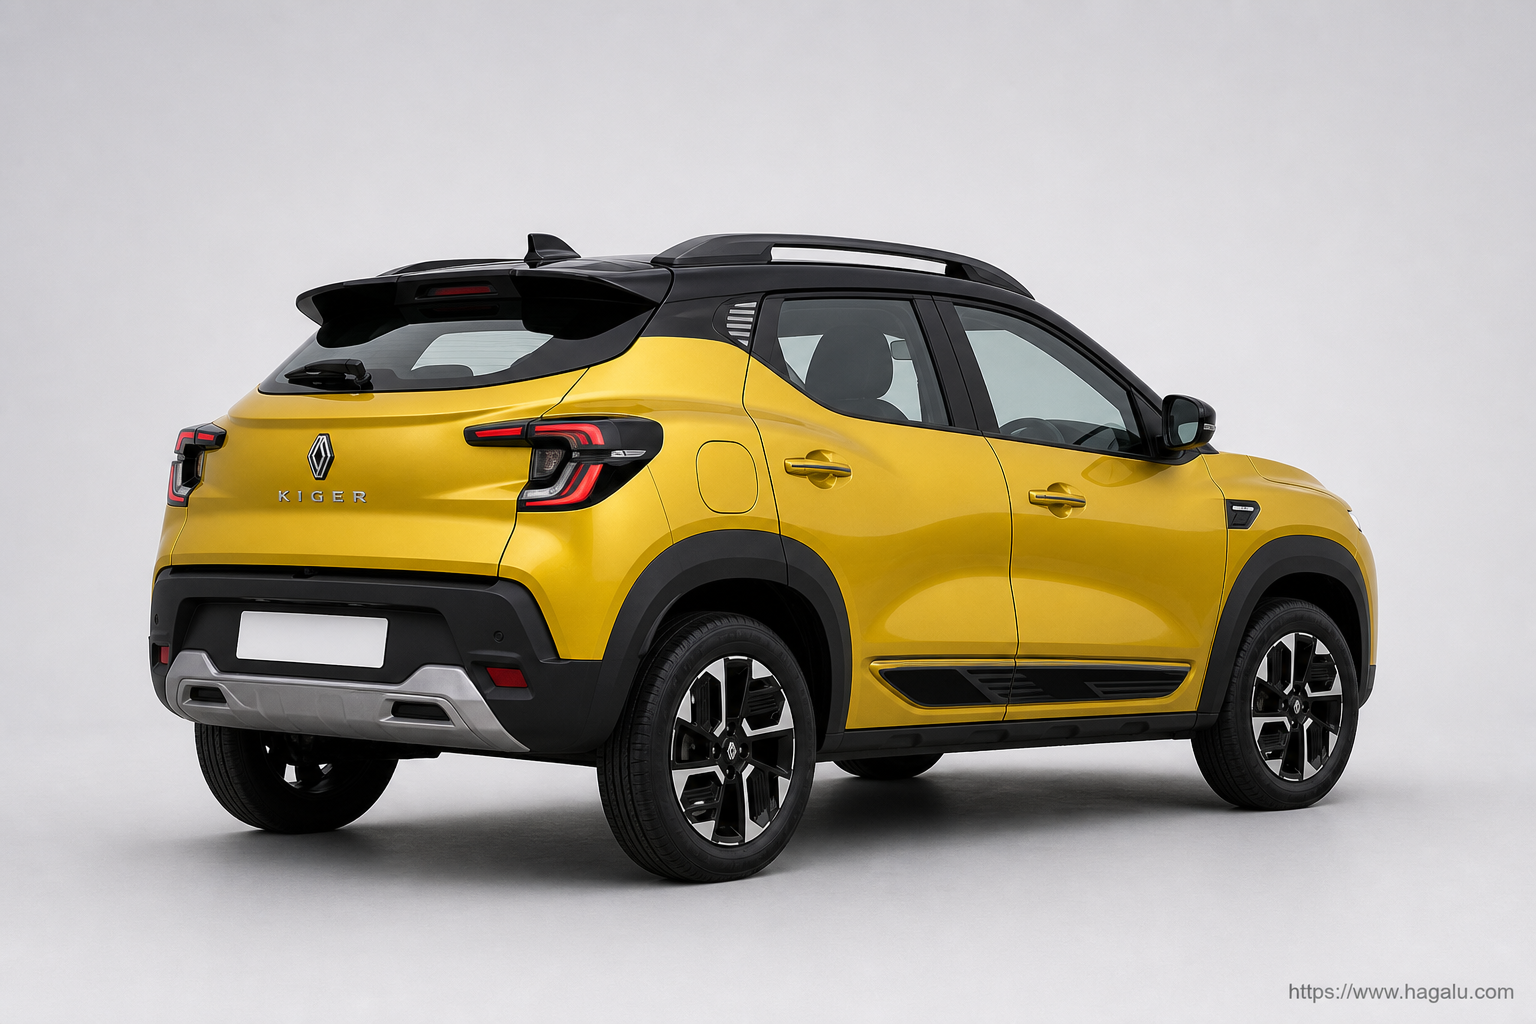
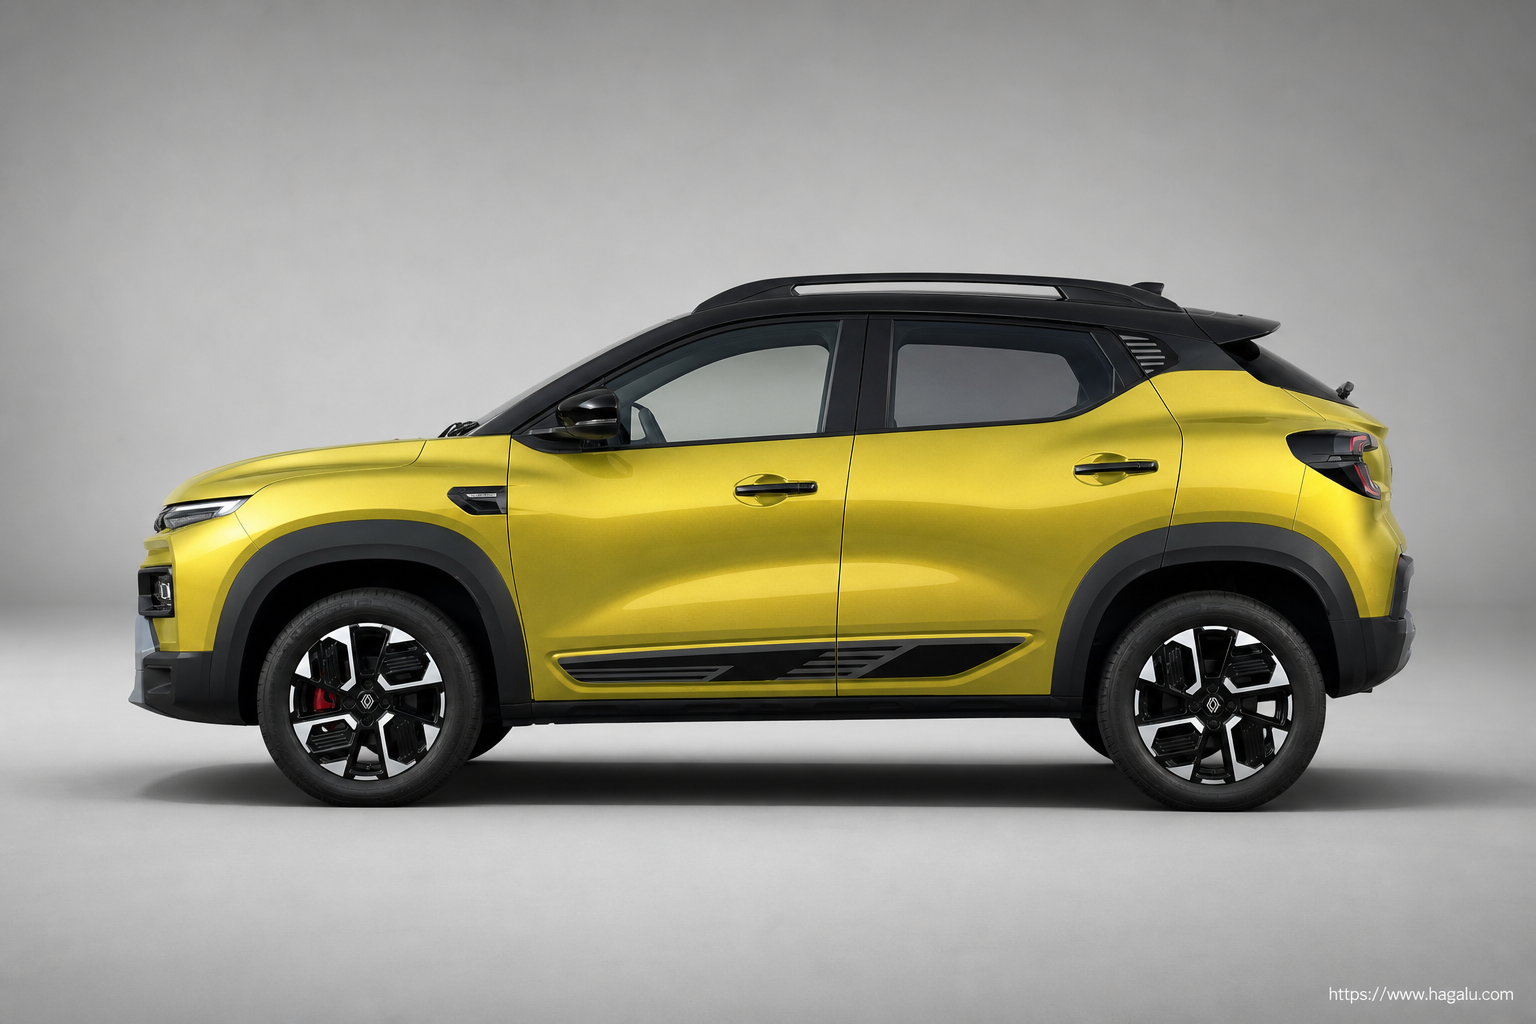
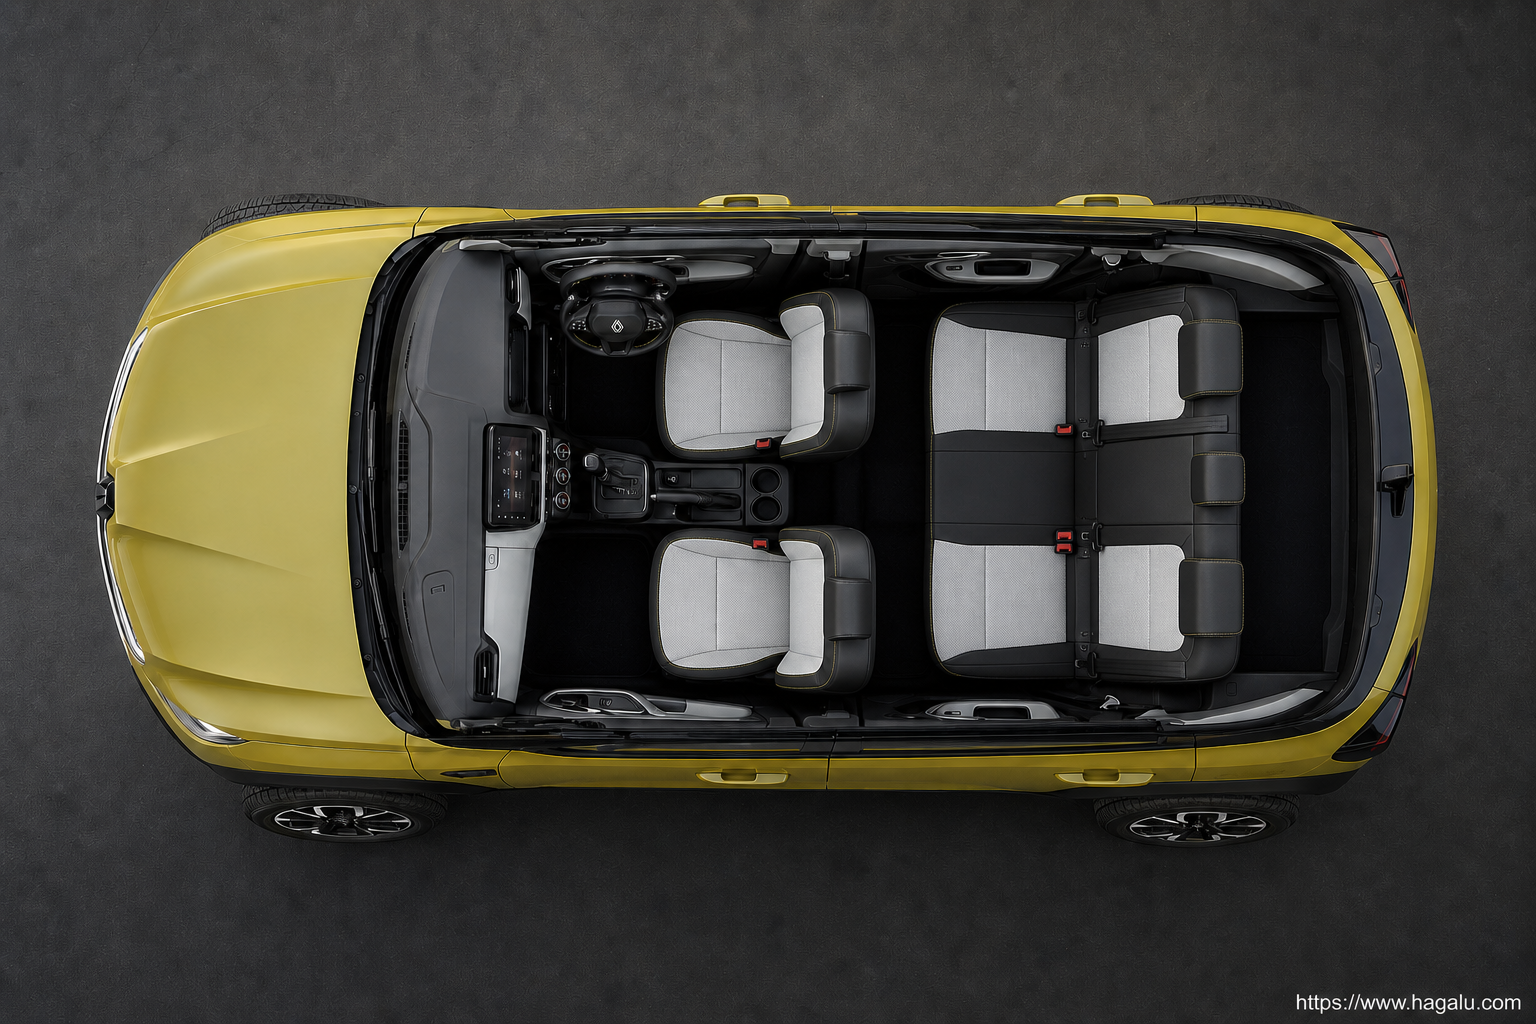
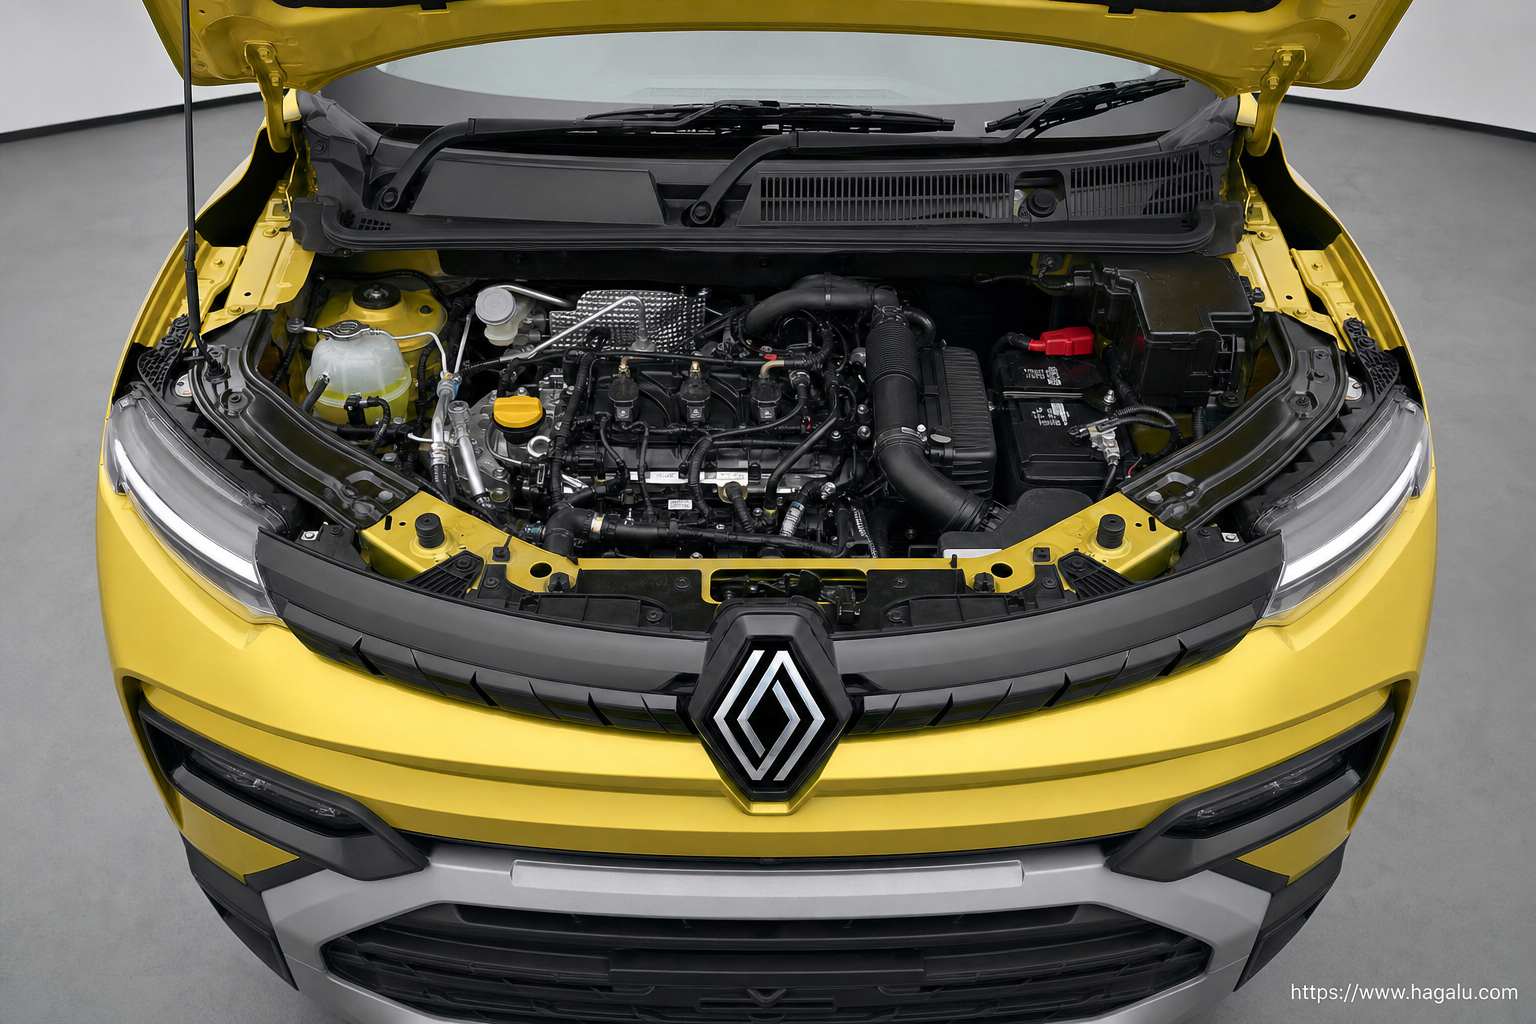
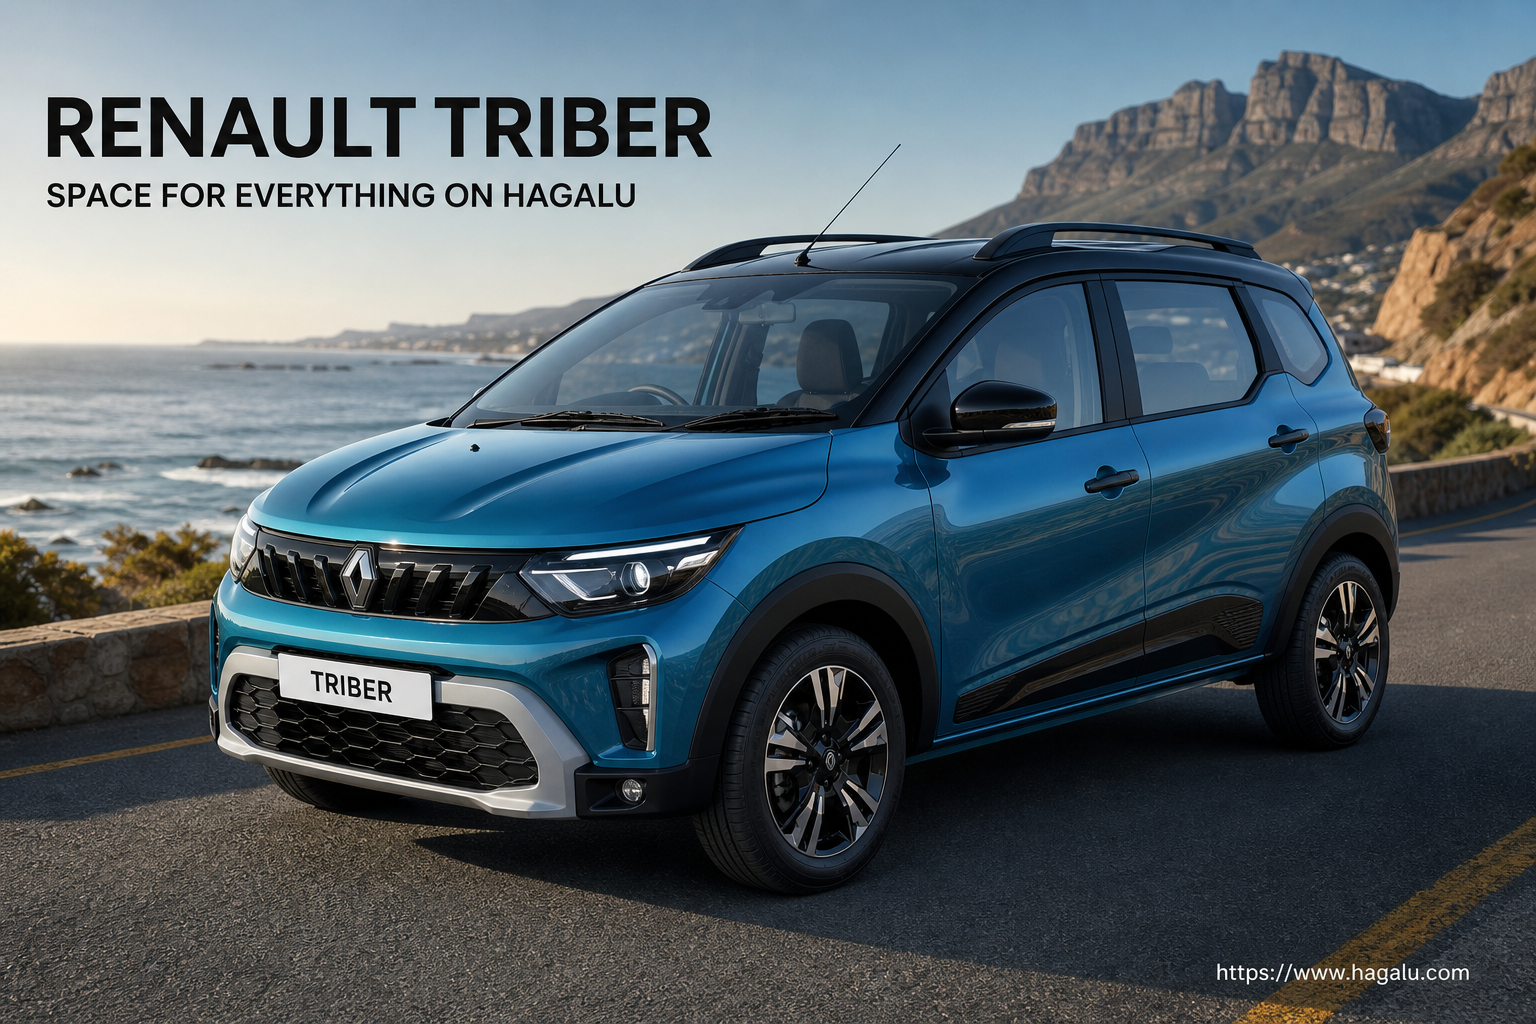
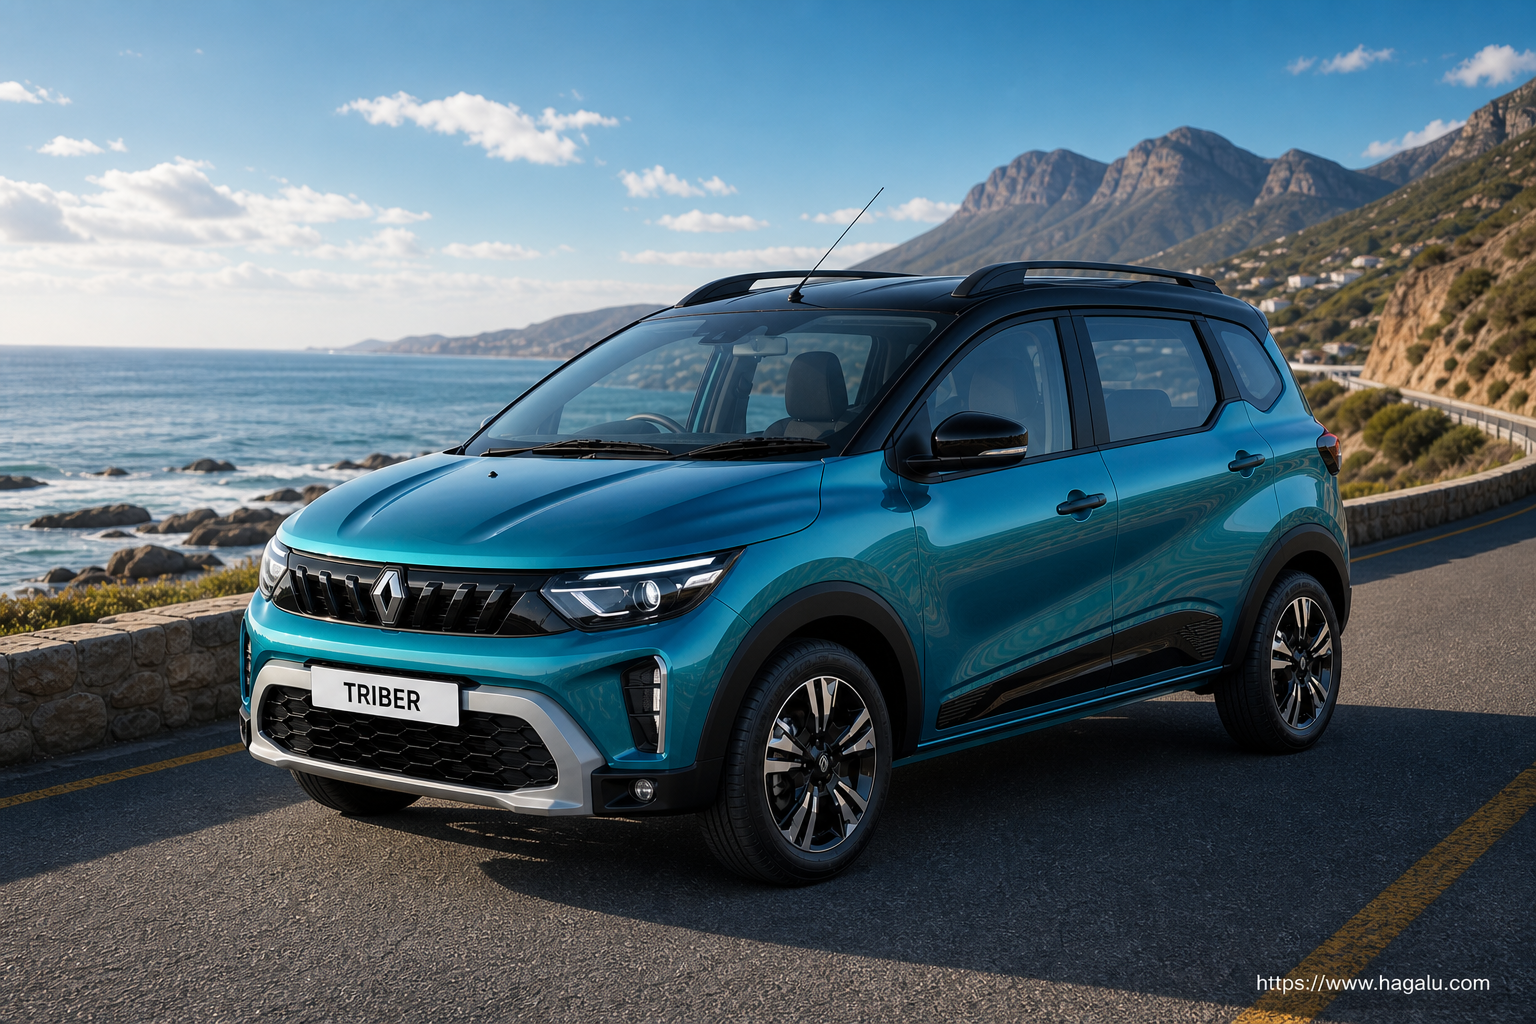
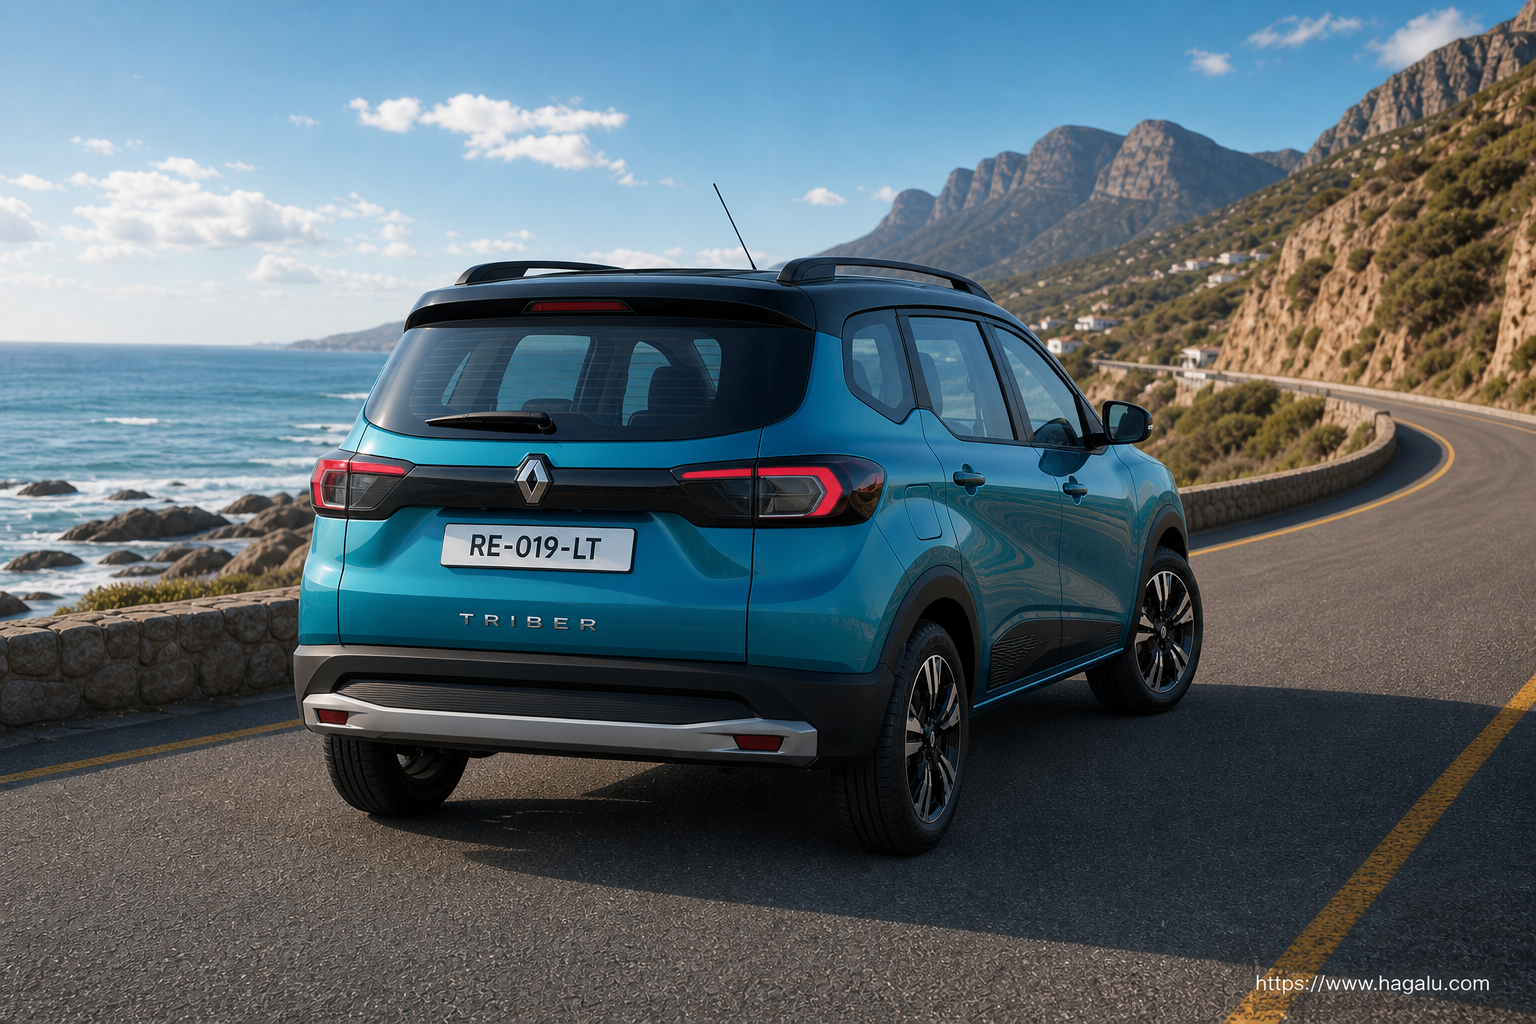
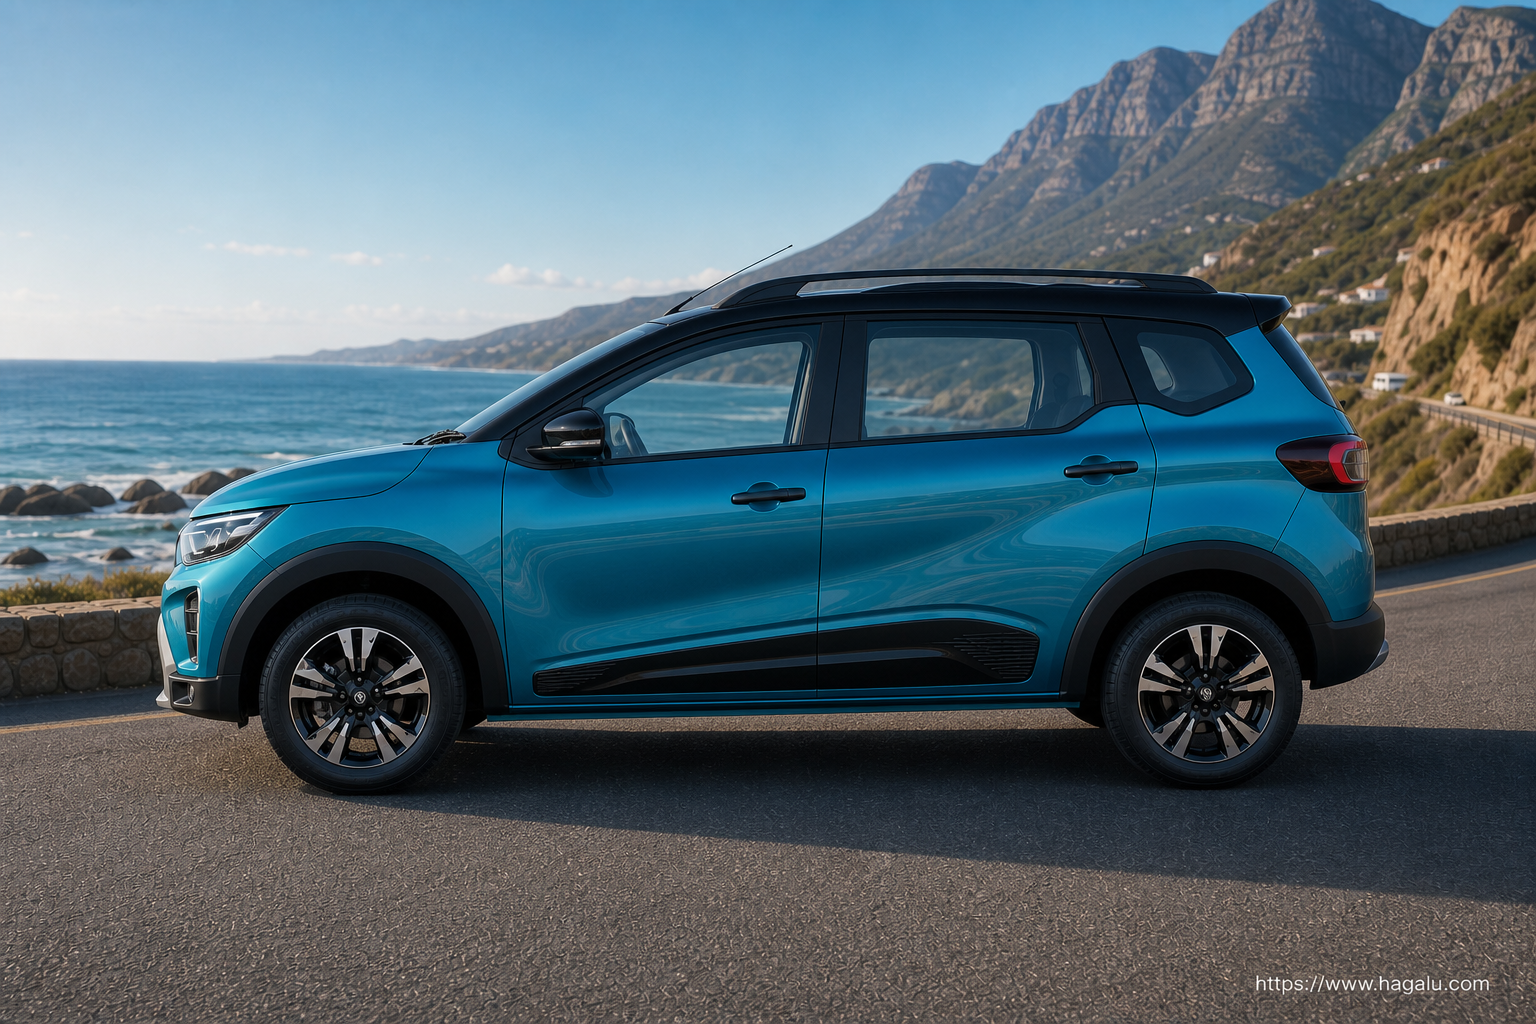
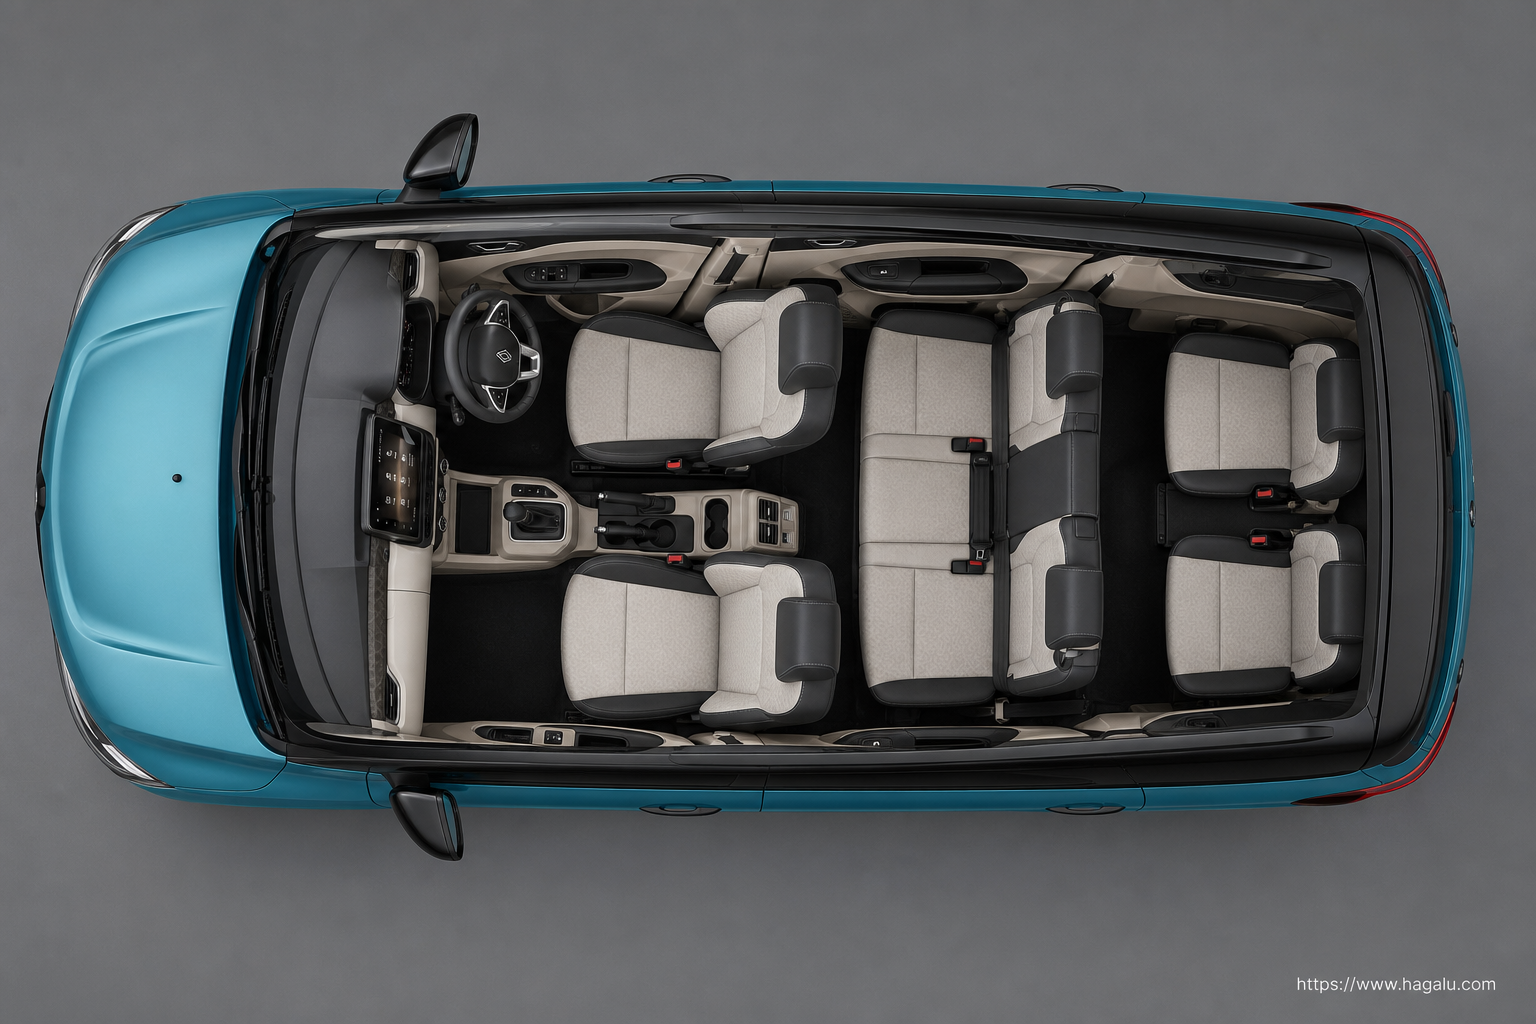
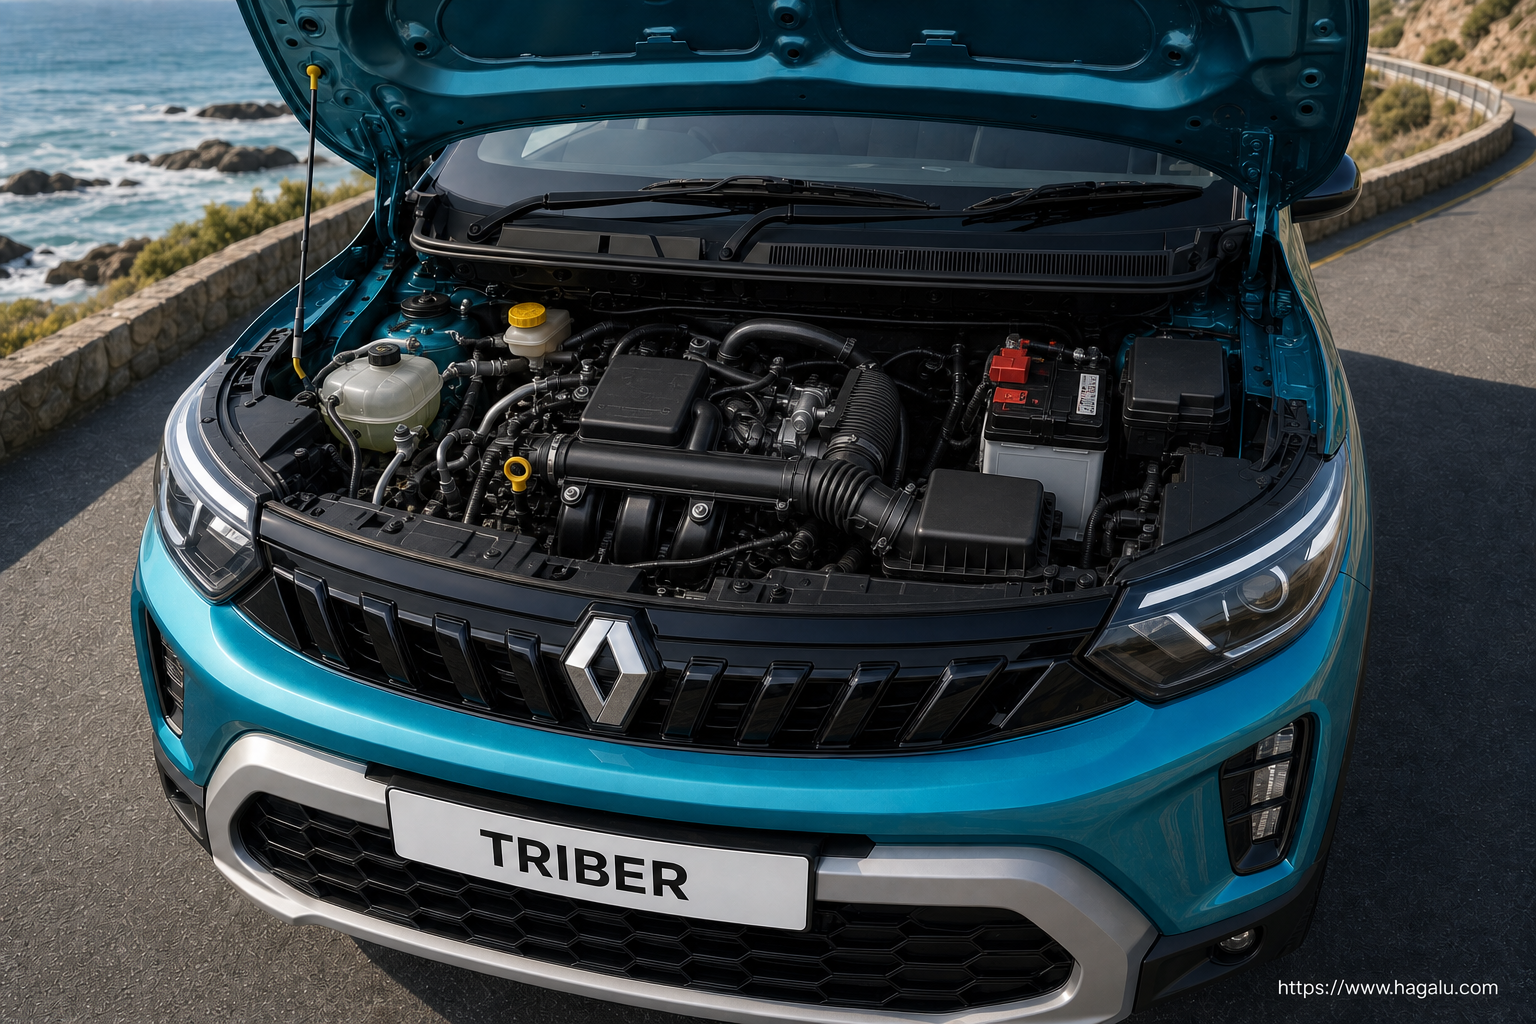
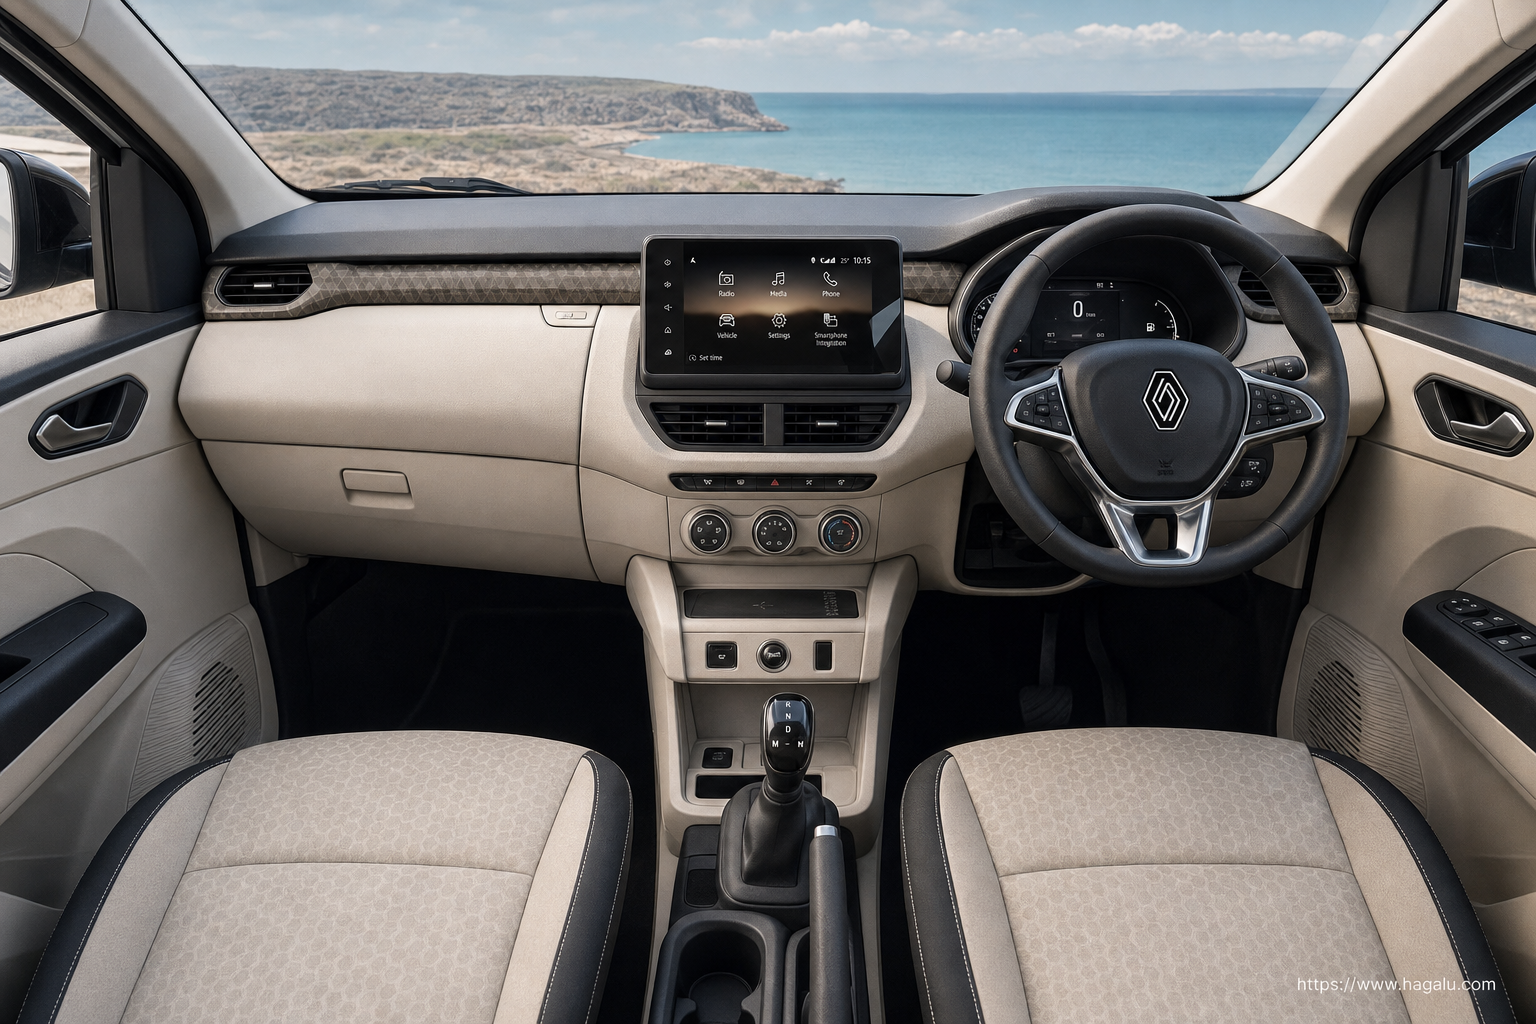
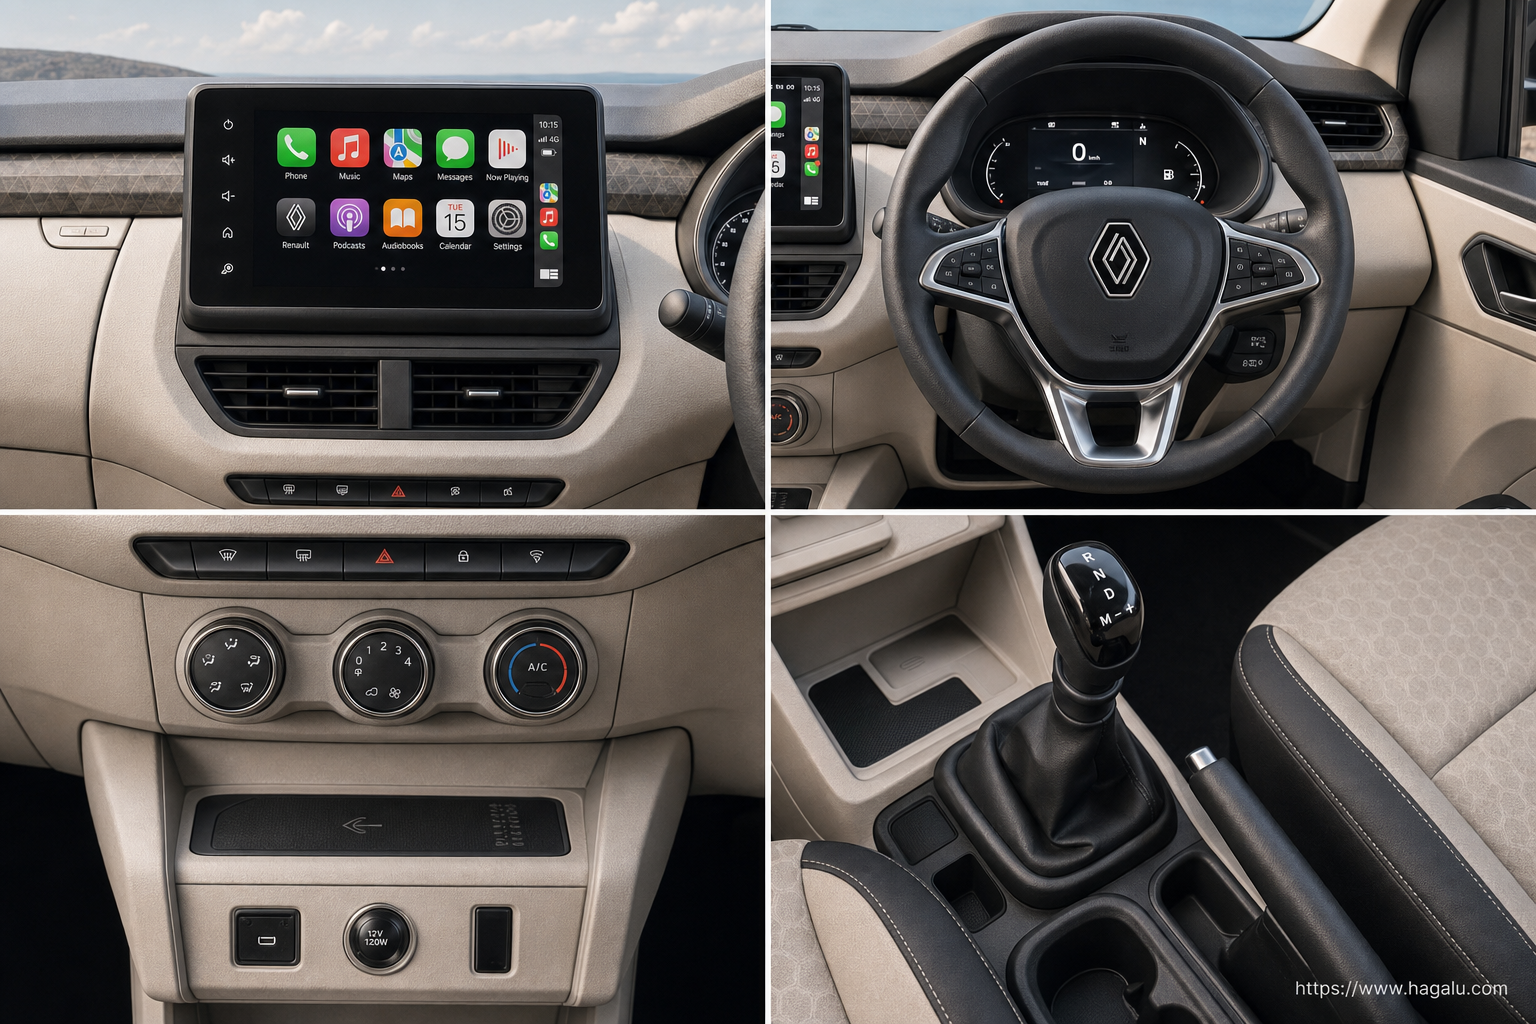
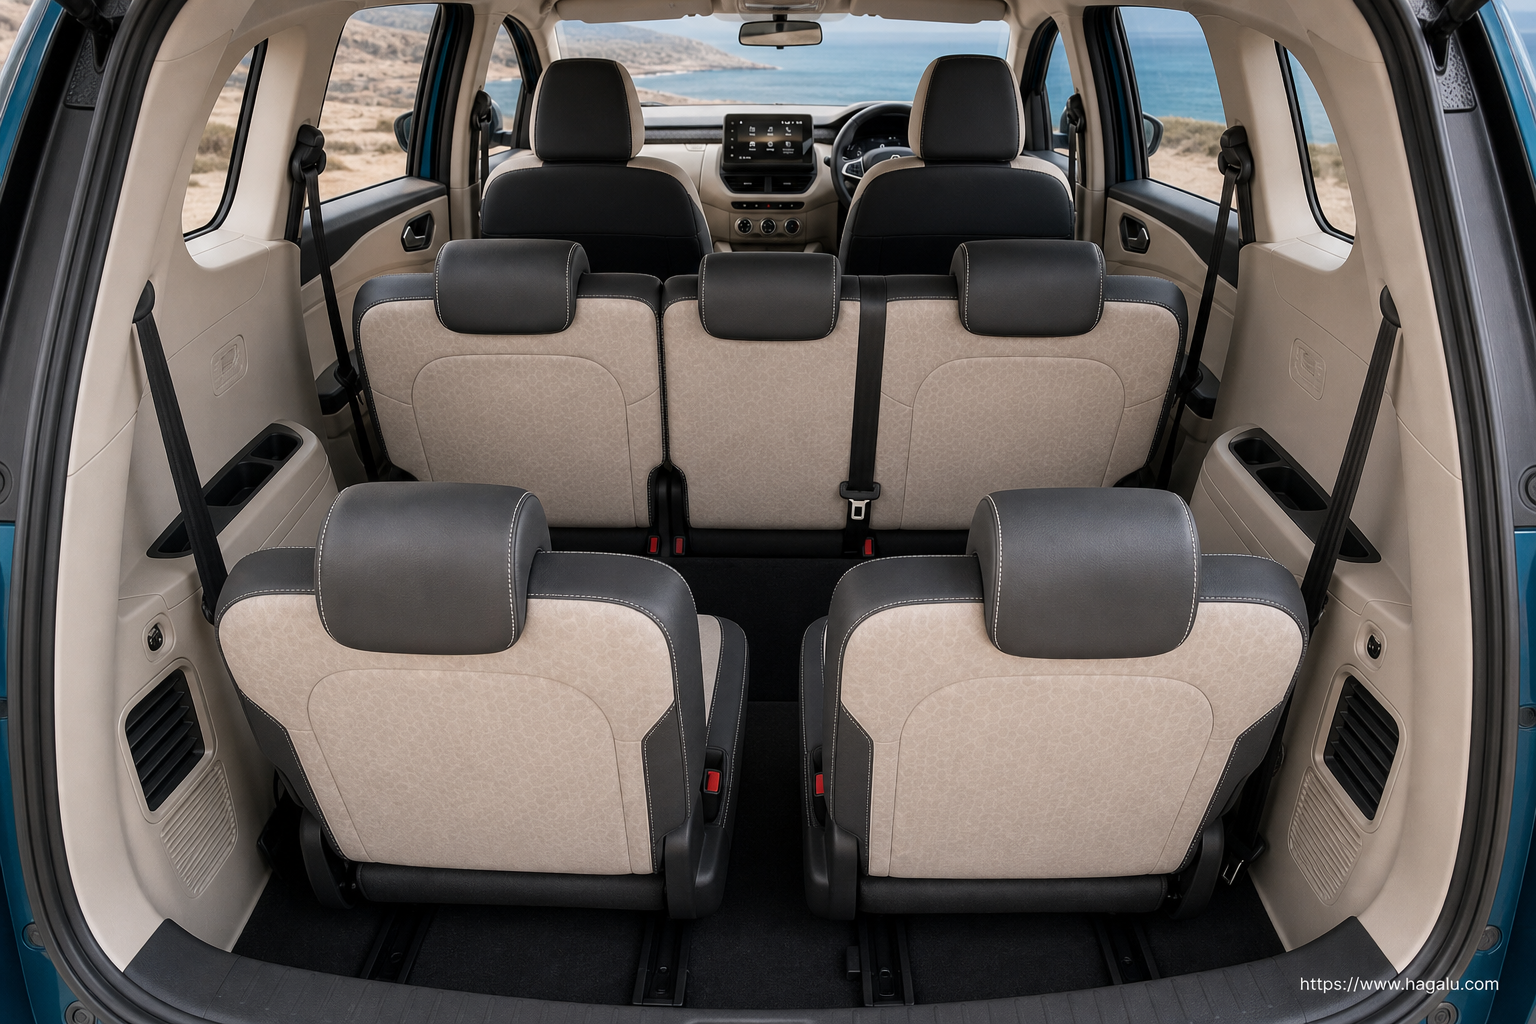
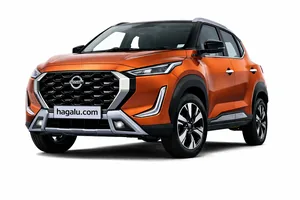
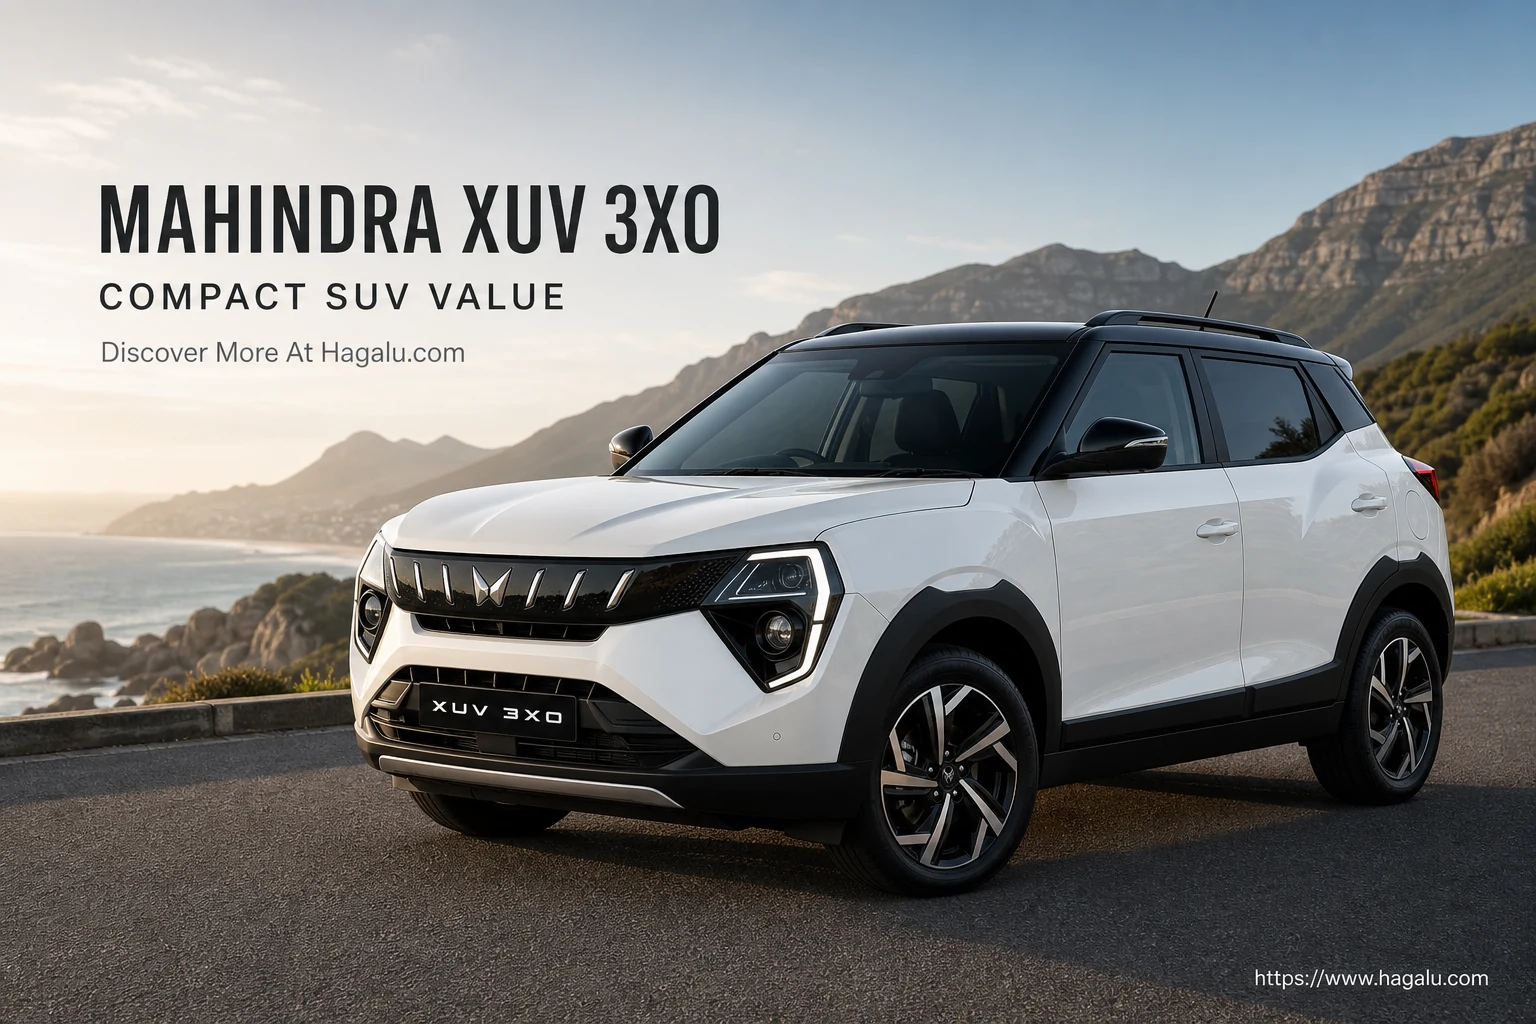
Model imagery
Kiger and Triber image comparison
Open an image for its full canonical file or visit the model page for the complete vehicle record.
A transparent comparison of published catalogue fields. This is not a road-test score, owner rating or editorial review rating, and it appears only when every vehicle clears the same comparable-data threshold.
Evidence / 100
Evidence-index readout
Triber leads by 4 points
Kiger and Triber are close on the comparable published fields, so buyer priorities should decide.
Close catalogue match. Buyer priorities should decide the outcome.
Why this scoreView full breakdown
Evidence-index leader
Triber
Performance
27/100
Efficiency
69/100
Safety
91/100
Practicality
83/100
Kiger
Performance
27/100
Efficiency
71/100
Safety
91/100
Practicality
65/100
What the evidence means
Evidence indexRenault Triber
leads the specification evidence index with 66 pts
vs 62 pts for Kiger
In Hagalu's specification evidence index, Triber leads. However, Kiger may suit buyers prioritising different confirmed fields. Ultimately, the right choice depends on your driving priorities in South Africa.
Related comparisons
Continue with closely related South Africa models and comparable body styles.
There is no universal winner. Use the comparison table to match the models and available derivatives in South Africa on price, safety equipment, space, powertrain and ownership cover. The category indicators summarise published catalogue data; they are not a road test or customer rating.
Compare the published consumption or mileage rows for the exact derivatives using the same unit and test basis. A catalogue figure is useful for like-for-like comparison, but traffic, speed, load, weather and driving style can change actual fuel use.
Compare only equipment explicitly listed for each derivative, including airbags, stability control and driver-assistance systems. Confirm the exact trim with the manufacturer, and treat any independent crash-test result separately because equipment and ratings can differ by market.
A reliable five-year total cannot be calculated from catalogue data alone. Add the exact purchase and finance cost, fuel or electricity, insurance quotes, scheduled servicing, tyres and expected resale value. Check whether the selected derivative includes a service or maintenance plan.
Use the seating, boot or load-space, ISOFIX and safety rows as a first check. Then test the exact cars with your child seats, passengers and typical luggage, because published dimensions do not show every access or comfort difference.
Compare the published power, torque and 0–100 km/h rows when they are available for both exact derivatives. Vehicle weight, gearing and power delivery also matter, so catalogue outputs alone do not establish real-world overtaking or response.
Compare
Request dealer offers
Let's discuss your next car
Share your interest so Hagalu can follow up about quotations and available discounts. The dealer confirms stock, price and terms.
✓
We've Got Your Details!
Your enquiry has reached Hagalu for follow-up. Any dealer offer will be confirmed separately by the seller.