A proper head-to-head in South Africa — we cover price, performance,
petrol economy, safety and what it'll actually cost you to own each one long term.
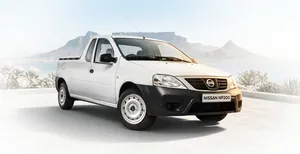
X-Trail holds a noticeable edge over NP300 Hardbody, especially in key ownership areas.
Where They Actually Differ
Performance
X-Trail
+1 pts
Efficiency
NP300 Hardbody
+7 pts
Safety
X-Trail
+6 pts
Practicality
X-Trail
+7 pts
Ownership
X-Trail
+8 pts
Score Breakdown by Category
🏆 Overall Winner
X-Trail
Performance
11/20
Efficiency
0/20
Safety
18/20
Practicality
15/20
Ownership
20/20
NP300 Hardbody
Performance
10/20
Efficiency
7/20
Safety
12/20
Practicality
8/20
Ownership
12/20
What Each Car Gets Right (and Wrong)
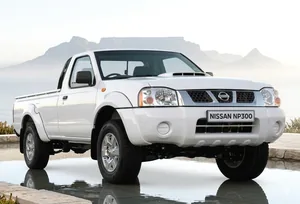
NP300 Hardbody
Strengths
Better fuel efficiency
Weak Spots
Less powerful engine setup
Less comprehensive safety features
Less practical in daily usage
Shorter warranty coverage
Best suited to:Fuel Efficiency
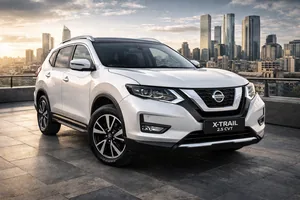
🏆 Overall Winner
X-Trail
Strengths
More powerful engine output
Stronger safety package
More practical for daily use
Better long-term ownership value
Weak Spots
Lower fuel efficiency
Best suited to:Highway DrivingFamily Usage
Which One's Right for You?
NP300 Hardbody
Buyers looking for better fuel efficiency
X-Trail
Drivers who prioritise strong highway performance and overtaking power
Families prioritising stronger safety equipment
Large families needing more practicality and usability
Long-term owners valuing warranty and ownership peace of mind
Full Specs, Side by Side
Spec
NP300 Hardbody
X-Trail
Ground Clearance
215
210
Wheelbase
2500
2705
Length
4875
4680
Width
1760
1840
Height
1655
1725
Kerb Weight
1395
1610
Gross Vehicle Weight
2400
2190
Seating Capacity
5
5
Boot Space
Not Applicable
565
Towing Capacity
2500
1500
Front Track Width
1495
-
Rear Track Width
1490
-
Turning Radius
5.8
-
Load Bed Length
1907
-
Load Bed Width
1454
-
Spec
NP300 Hardbody
X-Trail
Engine
2.5L Turbocharged Diesel
2.5L Naturally Aspirated Petrol
Engine Type
Inline 4 Cylinder Turbocharged
Inline 4-cylinder DOHC
Displacement
2488
2488
Cylinders
4
4
Valves per Cylinder
4
4
Power
98
126
Power @ RPM
3600 rpm
-
Torque
304
233
Torque @ RPM
1750-2500 rpm
-
Fuel System
Common Rail Direct Injection
Direct Injection
Turbocharger
Single Turbo
-
Top Speed
168
195
0-100 km/h
12.5
10.5
Compression Ratio
17.5:1
-
Engine Position
Front Longitudinal
-
Spec
NP300 Hardbody
X-Trail
Transmission
7-Speed Automatic
X-Tronic CVT
Drive Type
4WD
4x2
Drivetrain Layout
Part-Time 4WD
Front Wheel Drive
LSD Available
Not Available
Electronic
Paddle Shifters
Not Available
-
Transfer Case
Standard
None
Differential Lock
Rear Lock
-
Spec
NP300 Hardbody
X-Trail
Claimed Mileage
11.4
13.5
City Mileage
9
10.2
Highway Mileage
12
14.8
Fuel Tank Capacity
75
60
Emission Standard
Euro 5
Euro 6
AdBlue Tank Capacity
Not Applicable
-
Auto Start Stop
Not Available
-
Spec
NP300 Hardbody
X-Trail
Airbags
4
6
ABS
Standard
Standard
Electronic Stability Control
Standard
Standard
Traction Control
Standard
Standard
Hill Descent Control
Not Available
Not Available
Hill Start Assist
Standard
-
Child Safety Lock
Standard
Standard
ISOFIX Mounts
Standard
Standard
Brake Assist
Standard
Standard
Tyre Pressure Monitor
Not Available
Standard
Engine Immobiliser
Standard
Standard
Alarm System
Standard
-
Central Locking
Standard
-
Side Impact Beams
Not Available
-
Spec
NP300 Hardbody
X-Trail
Cruise Control
Not Available
Standard
Adaptive Cruise Control
Not Available
Not Available
Lane Keep Assist
Not Available
Not Available
Lane Departure Warning
Not Available
-
Blind Spot Monitoring
Not Available
Not Available
Rear Cross Traffic Alert
Not Available
Not Available
Parking Sensors
Not Available
Rear
Rear View Camera
Standard
Standard
360 Degree Camera
Not Available
Not Available
Autonomous Emergency Braking
Not Available
Standard
Driver Fatigue Alert
Not Available
-
Traffic Sign Recognition
Not Available
-
Spec
NP300 Hardbody
X-Trail
Seat Material
Fabric
Cloth
Seat Adjustment
Manual
Manual
Heated Seats
Not Available
Not Available
Ventilated Seats
Not Available
Not Available
Steering Type
Hydraulic Power Assisted
Electric Power Steering
Steering Adjustment
Tilt Adjustable
Tilt and Telescopic
Ambient Lighting
Not Available
Not Available
Folding Rear Seats
60/40 Split
-
Front Armrest
Standard
-
Rear Armrest
Standard
-
Spec
NP300 Hardbody
X-Trail
Climate Control
Manual AC
Manual Air Conditioning
Power Windows
Front
Standard
Keyless Entry
Not Available
Standard
Push Button Start
Not Available
Standard
Wireless Charging
Not Available
Not Available
Sunroof
Not Available
Not Available
Electric Tailgate
Not Available
Not Available
Automatic Headlamps
Not Available
-
Rain Sensing Wipers
Not Available
-
Auto Dimming Mirror
Not Available
-
Spec
NP300 Hardbody
X-Trail
Infotainment Screen
7-inch Touchscreen
8-inch Touchscreen
Apple CarPlay
Standard
Standard
Android Auto
Standard
Standard
Bluetooth Connectivity
Standard
Standard
Number of Speakers
4
6
Navigation System
Not Available
Optional
Digital Instrument Cluster
Not Available
-
USB Ports
1
-
Wireless Apple CarPlay
Not Available
-
Spec
NP300 Hardbody
X-Trail
LED Headlamps
Halogen
Halogen
Daytime Running Lamps
Not Available
LED
Fog Lamps
Standard
Front
Roof Rails
Not Available
Standard
Alloy Wheel Design
Steel Wheels
17-inch Alloy
Chrome Exterior Finish
Not Available
-
Body Cladding
Not Available
-
Rear Spoiler
Not Available
-
Spec
NP300 Hardbody
X-Trail
Tyre Size
235/75 R15
225/65 R17
Wheel Type
Steel
Alloy
Front Brake Type
Ventilated Disc
Ventilated Disc
Rear Brake Type
Drum
Disc
Spare Wheel Type
Full Size Steel Under-bed
-
Spec
NP300 Hardbody
X-Trail
Front Suspension
Double Wishbone
Independent Strut
Rear Suspension
Leaf Spring
Multi-link
Chassis Type
Ladder Frame
Monocoque
Power Steering
Hydraulic
-
Steering Column
Tilt Adjustable
-
Spec
NP300 Hardbody
X-Trail
Service Interval
10,000 km or 6 Months
15000 km / 12 months
Approx Service Cost
Approx R3,500
Moderate
Battery Warranty
Not Applicable
2 Years
Maintenance Plan
Not Available
-
Spec
NP300 Hardbody
X-Trail
Warranty Years
3
6
Warranty Kilometers
100000
150000
Roadside Assistance
3 Years
6 Years
Anti-Corrosion Warranty
6 Years
-
Spec
NP300 Hardbody
X-Trail
CO2 Emissions
228
210
Start Stop System
Not Available
Standard
Hybrid System Type
Not Applicable
None
Noise Level
74
-
Spec
NP300 Hardbody
X-Trail
Approach Angle
29
18
Departure Angle
23
22
Wading Depth
600
350
Terrain Modes
Not Available
None
Locking Differential
Rear
None
Underbody Protection
Partial
-
So, Which One Should You Buy?
🏆Nissan X-Trail
wins with 64 pts
vs 49 pts for NP300 Hardbody
In structured scoring, X-Trail emerges as the stronger overall package. However, NP300 Hardbody may appeal to buyers prioritising different factors. Ultimately, the right choice depends on your driving priorities in South Africa.
Other Comparisons Worth Checking
See how similar cars go head-to-head — you might find a better fit than you expected.
While resale depends on market demand, ownership and brand positioning suggest X-Trail may hold stronger long-term value.
Off-road suitability depends on drivetrain and ground clearance. Refer to the full specification comparison for detailed technical differences.
Efficiency and ownership categories influence running costs. X-Trail performs slightly stronger overall in structured scoring.
Value depends on feature set, performance and ownership coverage. Structured comparison gives X-Trail the overall advantage.
In Depth — Breaking It All Down
The comparison between NP300 Hardbody and X-Trail in South Africa
evaluates performance, efficiency, safety, practicality and long-term ownership value.
Performance: NP300 Hardbody scores 10 vs 11.
Efficiency: NP300 Hardbody scores 7 vs 0.
Safety: NP300 Hardbody scores 12 vs 18.
Practicality: NP300 Hardbody scores 8 vs 15.
Ownership: NP300 Hardbody scores 12 vs 20.
Final structured scoring gives X-Trail
the advantage in this comparison.
Compare
Get Best Price
We'll Contact You
Fill in your details and a dedicated executive will reach out shortly.
✓
We've Got Your Details!
An executive will contact you shortly. Thank you for your interest.