Source type: Toyota Kenya
Toyota Rush vs Hyundai STARIA
A proper head-to-head in Kenya — compare price, performance, fuel economy or electric range, safety and the details that shape long-term ownership.
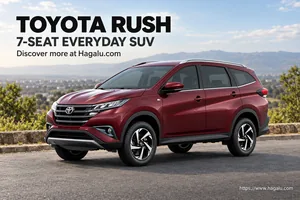
Toyota Rush
1.5L Petrol AT 4x2
Petrol
4-Speed Automatic
Current
KES 5,100,000
ex-showroom
⚡ 77 kW
🔧 136 Nm
⛽ 15.2 km/l
VS
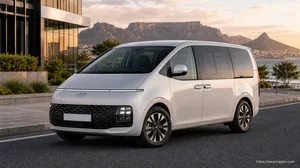
Hyundai STARIA
STARIA 2.2D Automatic
Diesel
8-Speed Automatic
Current
KES 8,950,000
ex-showroom
⚡ 130 kW
🔧 431 Nm
Decision summary
Toyota Rush vs Hyundai STARIA: the short answer
STARIA holds a noticeable catalogue-index lead over Rush.
Rush starts KES 4,150,000 cheaper
Rush from KES 4,800,000 · STARIA from KES 8,950,000
Five key differences
Exact selected derivatives| Specification | Rush | STARIA |
|---|---|---|
| Maximum Power | Rush77 kW @ 6000 rpm | STARIA130 kW |
| Maximum Torque | Rush136 Nm @ 4200 rpm | STARIA431 Nm |
| Engine Size | Rush1496 cc | STARIA2199 cc |
| Combined Fuel Economy | Rush15.2 km/l | STARIANot Officially Disclosed |
| Ground Clearance | Rush220 mm | STARIA186 mm |
Strongest published figure in that row; no road-test winner is implied.
Source type: Hyundai Kenya
What Each Car Gets Right (and Wrong)
Rush
Strengths
- Better fuel efficiency
Weak Spots
- Less powerful engine setup
- Fewer listed safety features
- Lower published practicality figures
Best suited to:
Published Efficiency
Specification evidence leader
STARIA
Strengths
- More powerful engine output
- Stronger listed safety equipment
- Stronger published practicality figures
Weak Spots
- Lower fuel efficiency
Best suited to:
Published Performance
Published Practicality
Which One's Right for You?
Rush
- Buyers prioritising the lower published fuel or energy use
STARIA
- Buyers prioritising the stronger published powertrain figures
- Buyers prioritising the more complete listed safety equipment
- Buyers prioritising the stronger published space and capacity figures
Full Specs, Side by Side
| Spec | Rush | STARIA |
|---|---|---|
| Model Introduced Year | Not Officially Disclosed | Not Officially Disclosed |
| Generation | Not Officially Disclosed | Not Officially Disclosed |
| Facelift History | Not Officially Disclosed | Not Officially Disclosed |
| Facelift Launched Since | Not Officially Disclosed | Not Officially Disclosed |
| Facelift Version Ending | Not Officially Disclosed | Not Officially Disclosed |
| Body Style | SUV | MPV |
| Model Year | Not Officially Disclosed | Not Officially Disclosed |
| Production Status | Active | Active |
| Segment | Kenya-market SUV | Kenya-market MPV |
| Vehicle Type | SUV | MPV |
| Spec | Rush | STARIA |
|---|---|---|
| Length | 4435 mm | 5253 mm |
| Width | 1695 mm | 1997 mm |
| Height | 1705 mm | 1990 mm |
| Wheelbase | 2685 mm | 3273 mm |
| Ground Clearance (Default) | 220 mm | 186 mm |
| Ground Clearance (With Full Seating Load) | 200 mm | 171 mm |
| Fuel Tank Capacity | 45 l | 75 l |
| Boot/Cargo Space | 213 l | 831 l |
| Kerb Weight | 1280 kg | 2190 kg |
| Gross Vehicle Weight (GVW) | 1870 kg | 2950 kg |
| Payload Capacity | 590 kg | 760 kg |
| Towing Capacity | 800 kg | 2500 kg |
| Seating Capacity | 7 seats | Not Officially Disclosed |
| Number of Rows | 3 rows | Not Officially Disclosed |
| Doors | 5 doors | 5 doors |
| Minimum Turning Radius | 5.2 m | 5.94 m |
| Front Headroom | Not Officially Disclosed | Not Officially Disclosed |
| Rear Headroom | Not Officially Disclosed | Not Officially Disclosed |
| Front Legroom | Not Officially Disclosed | Not Officially Disclosed |
| Rear Legroom | Not Officially Disclosed | Not Officially Disclosed |
In depth: how these cars differ
This Rush and STARIA comparison uses the exact derivatives selected above for Kenya. The catalogue index covers performance, efficiency, safety equipment, practicality and ownership cover only where comparable source-backed fields are present.
Performance index: Rush 35 vs STARIA 67.
Efficiency index: Rush 60 vs STARIA 46.
Safety-equipment index: Rush 54 vs STARIA 94.
Practicality index: Rush 60 vs STARIA 79.
Ownership-cover index: Rush not separately scored vs STARIA not separately scored.
These figures are Hagalu catalogue-comparison indicators, not customer ratings, crash-test scores, resale guarantees or a substitute for a road test. Each page shows its weighted source coverage beside the result.
Model imagery
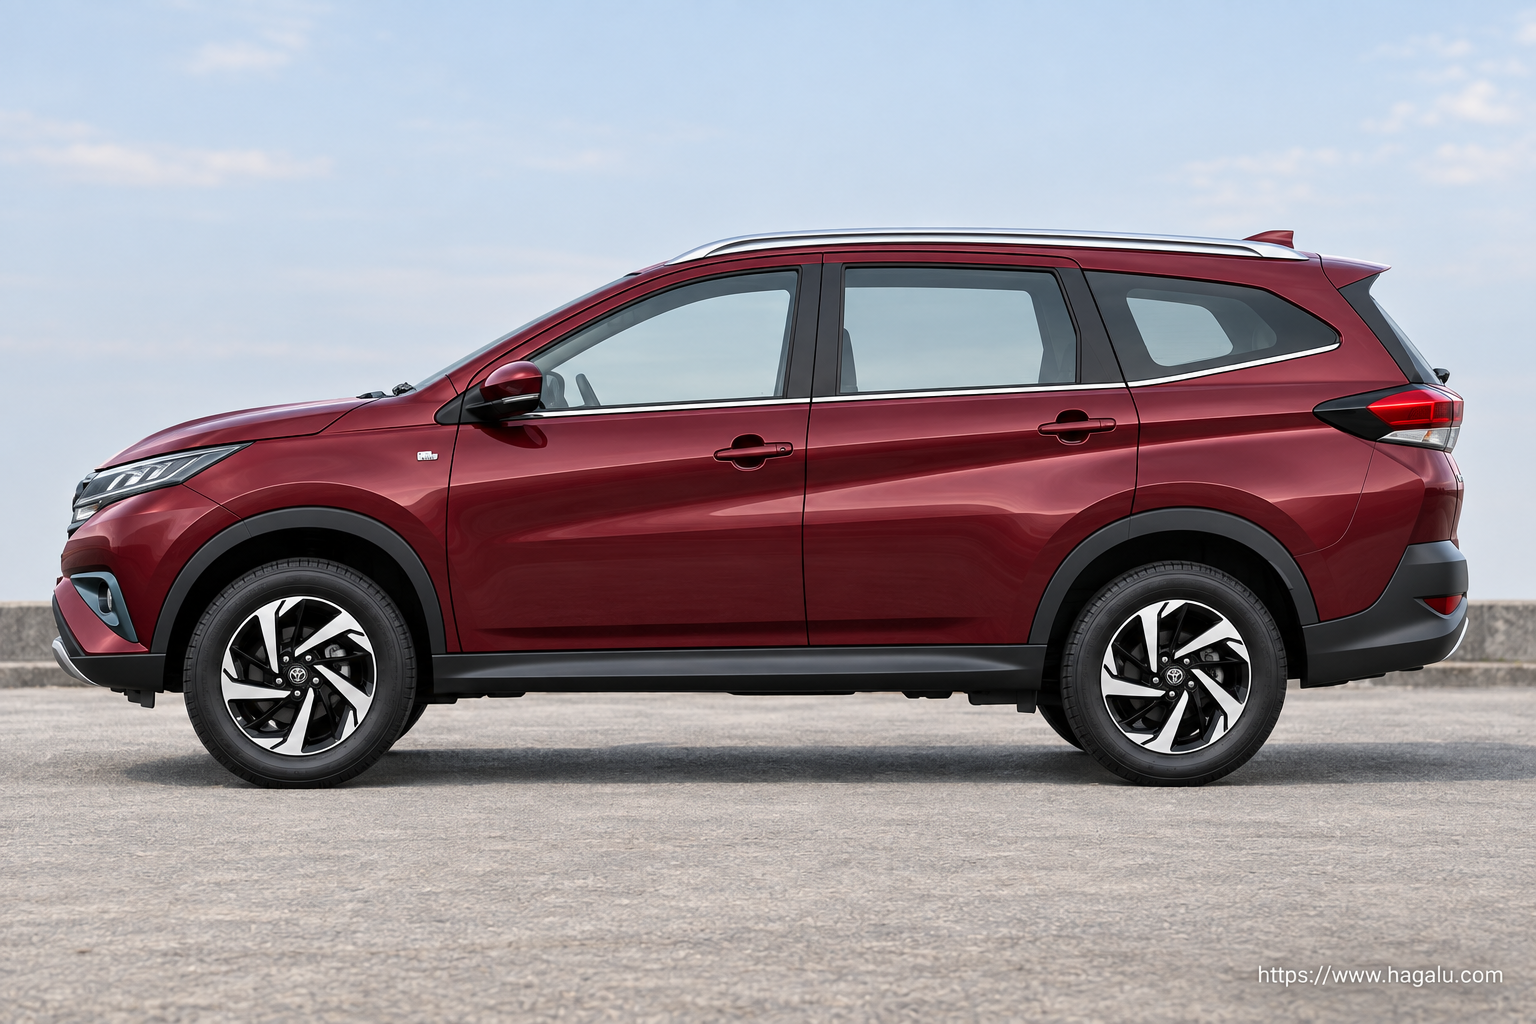
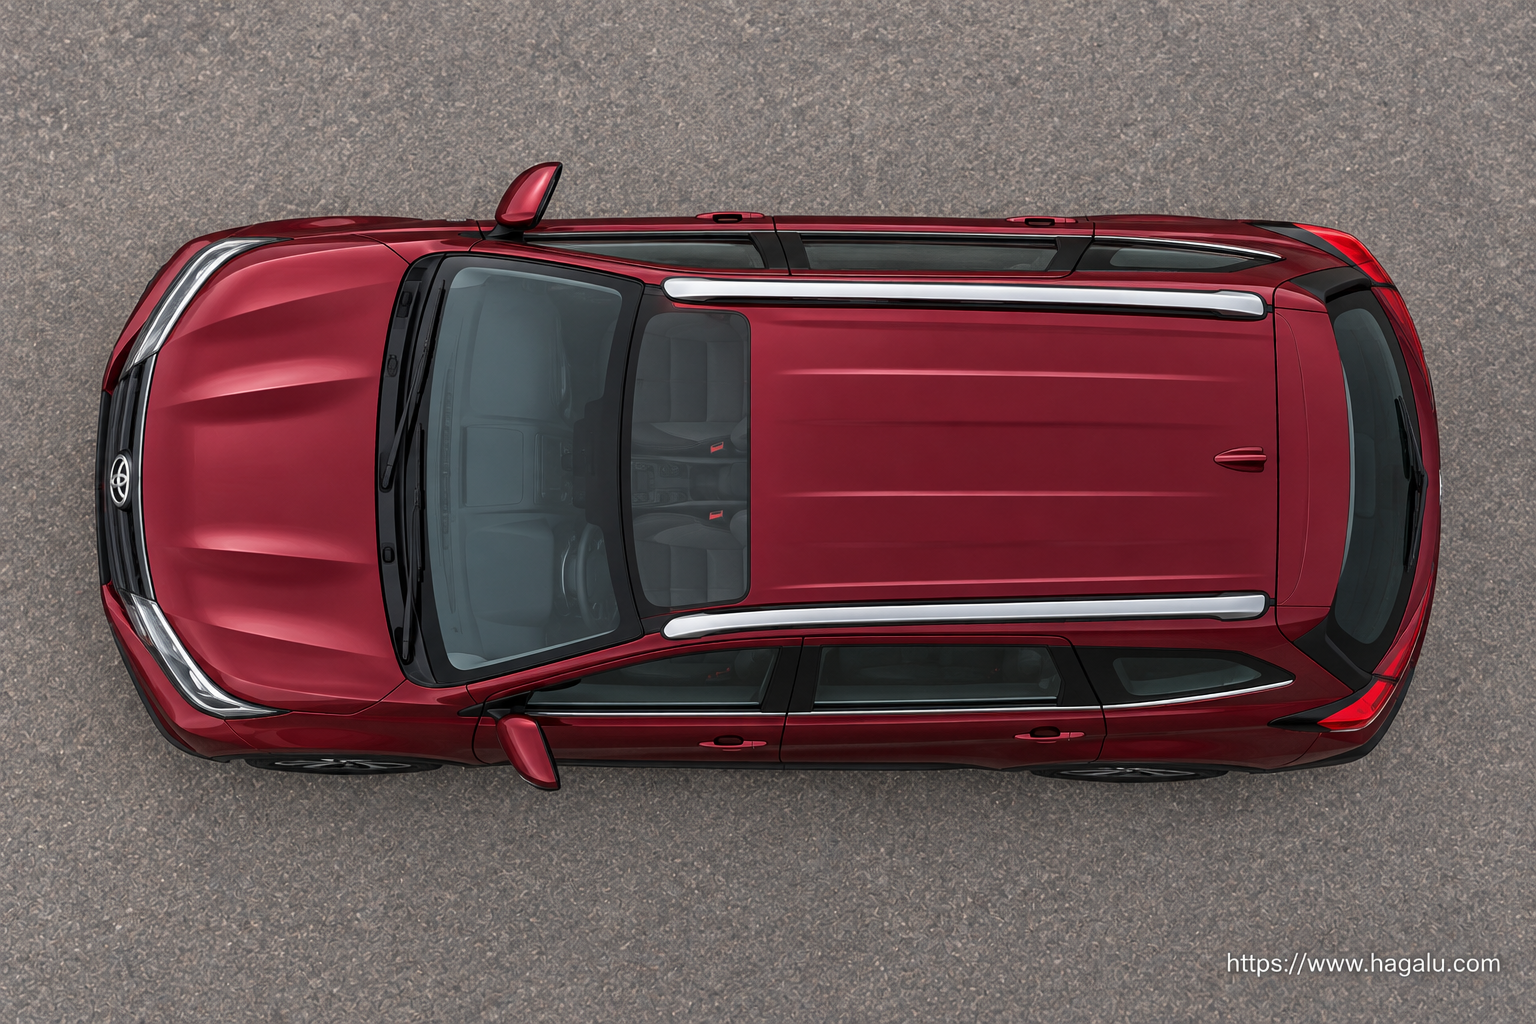
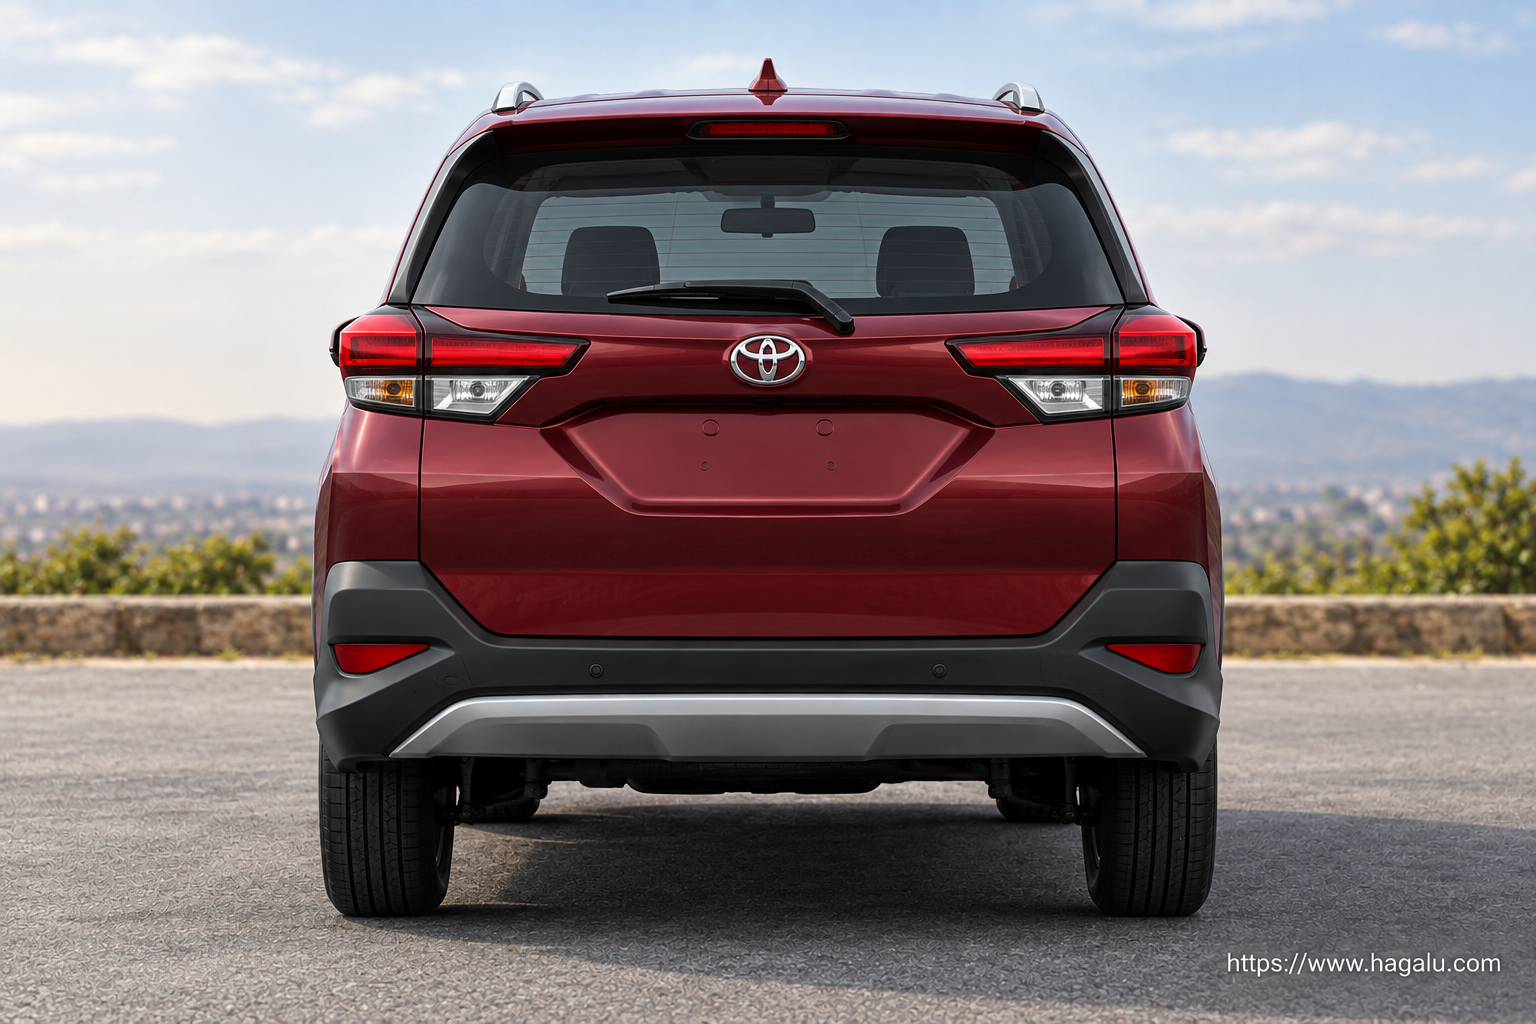
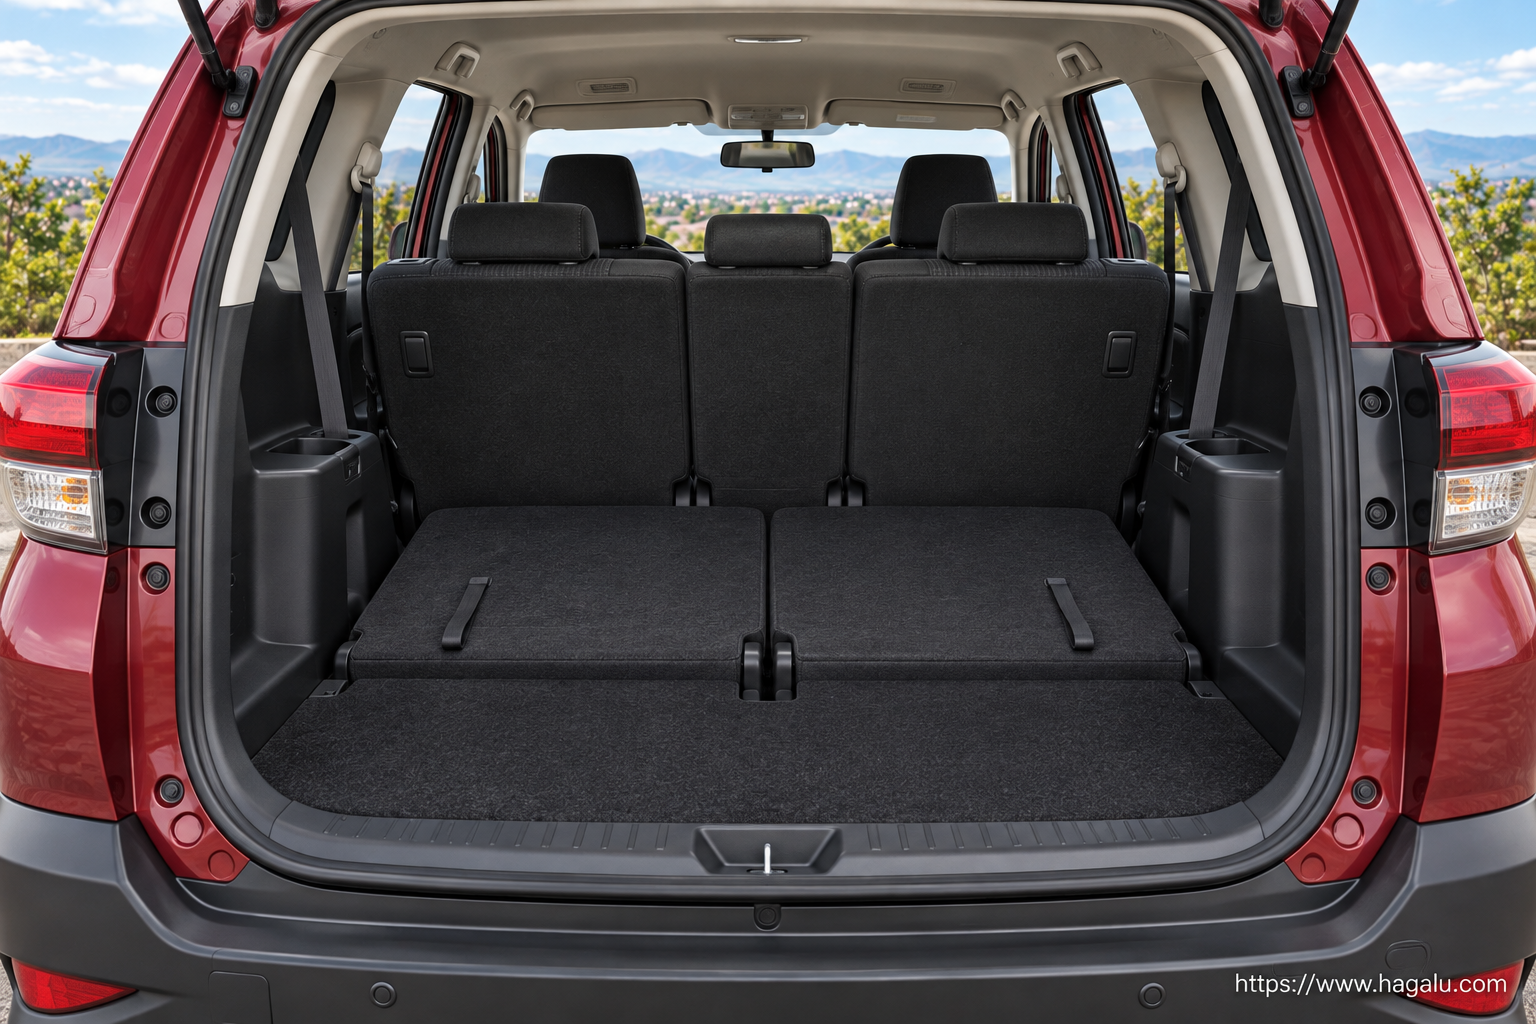
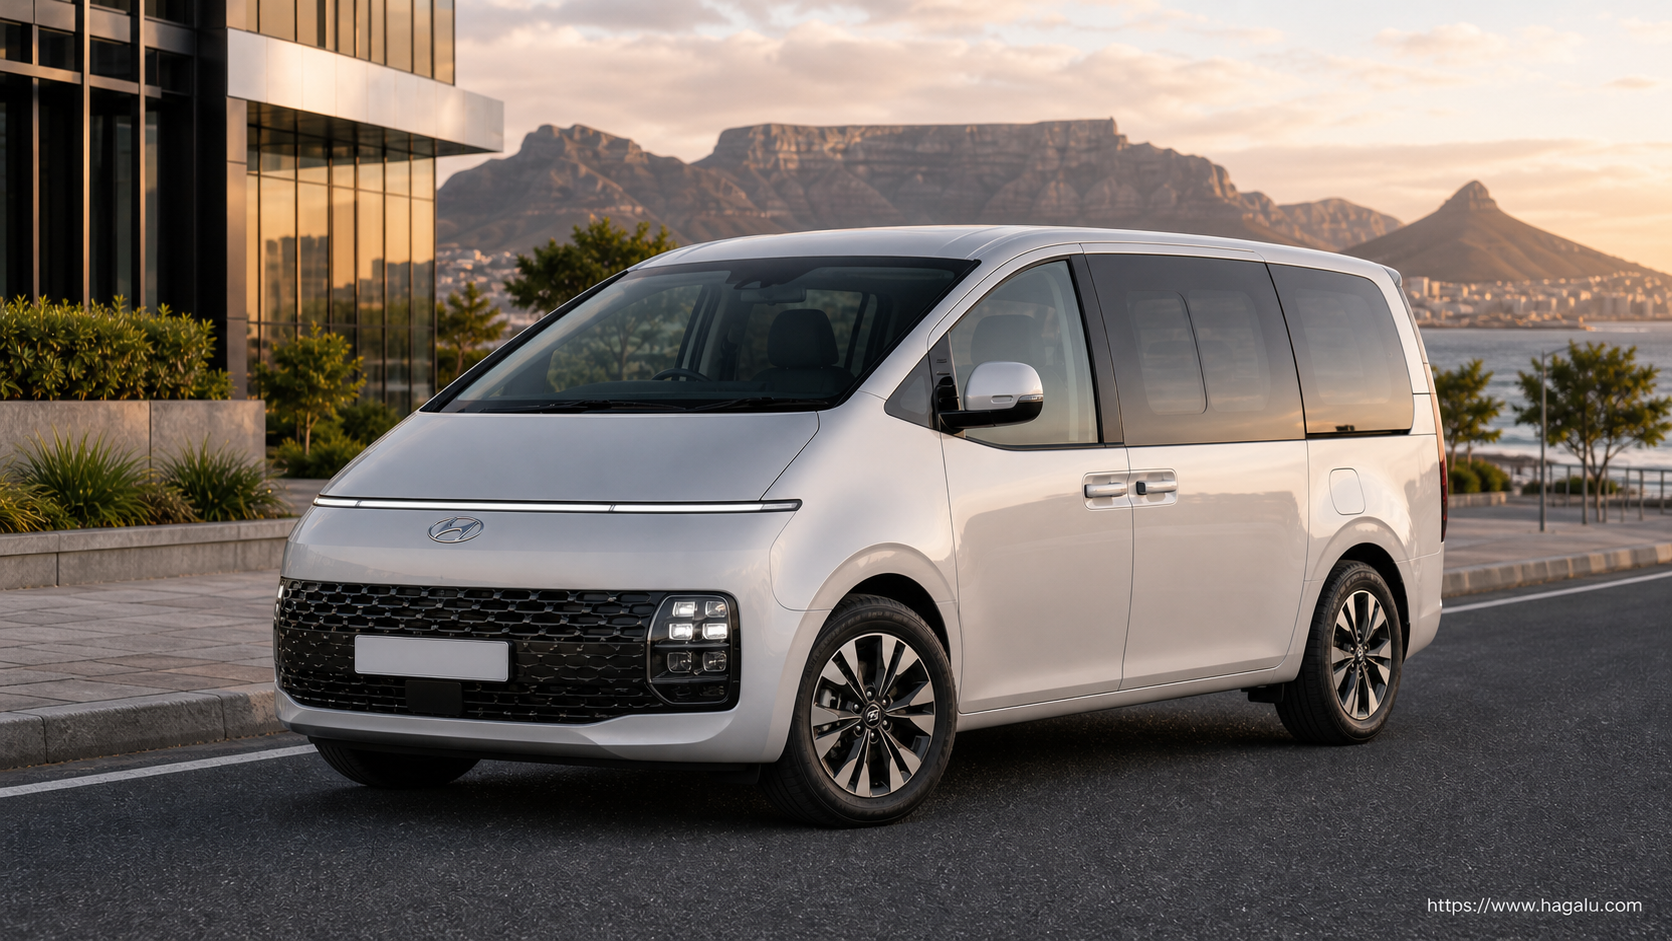
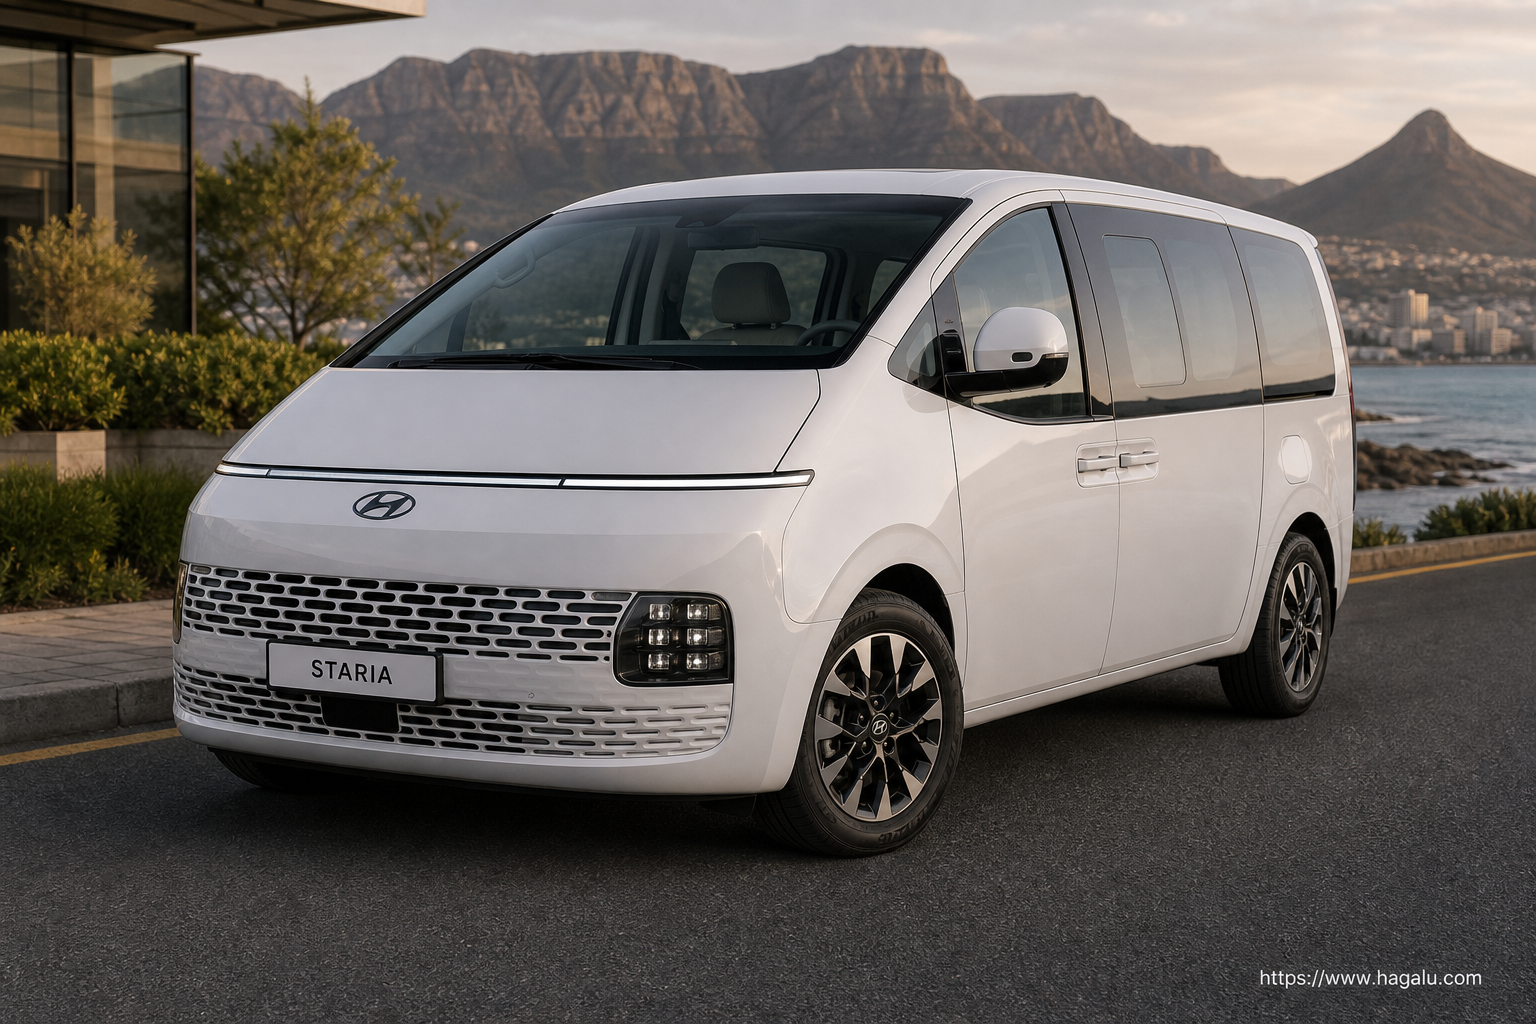
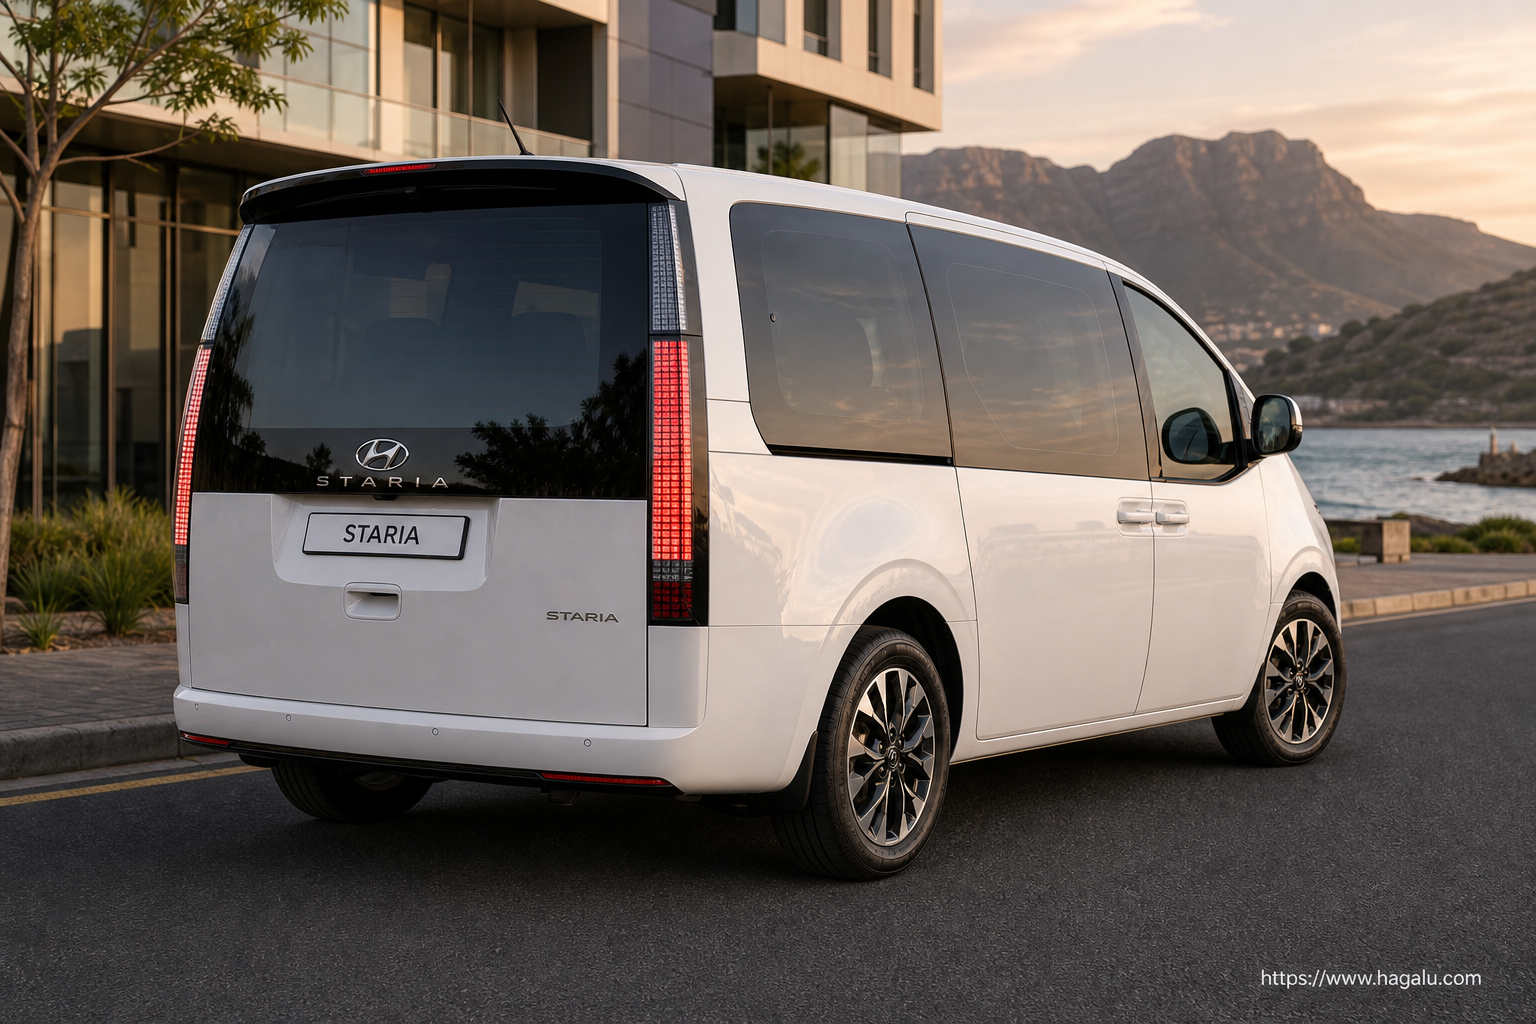
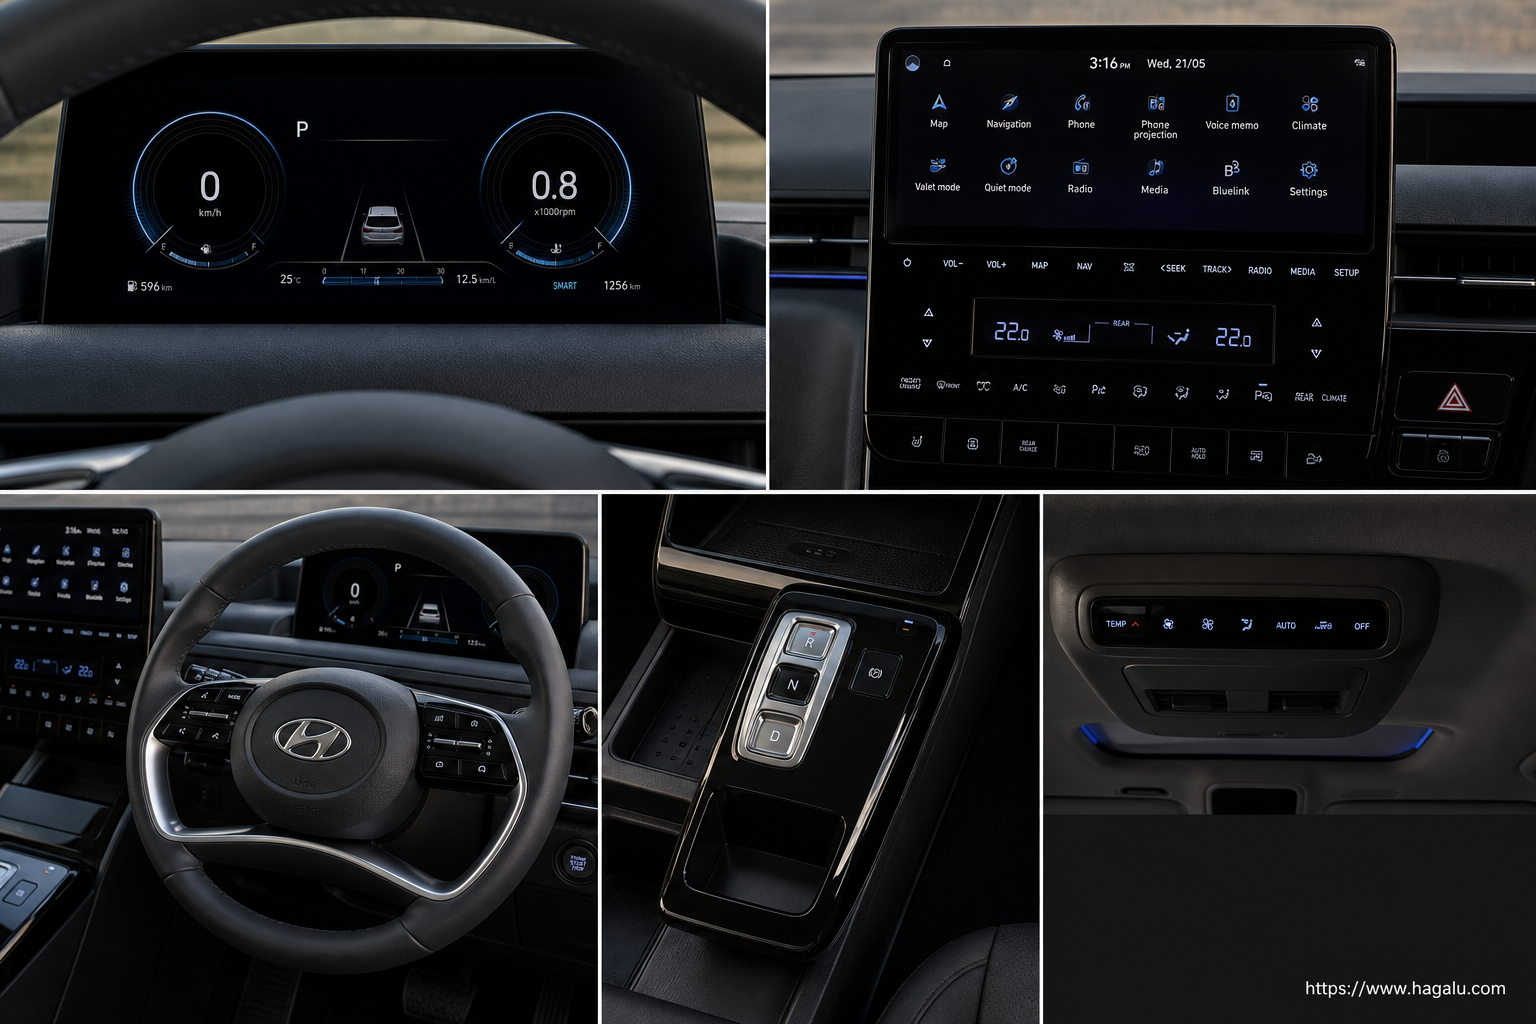
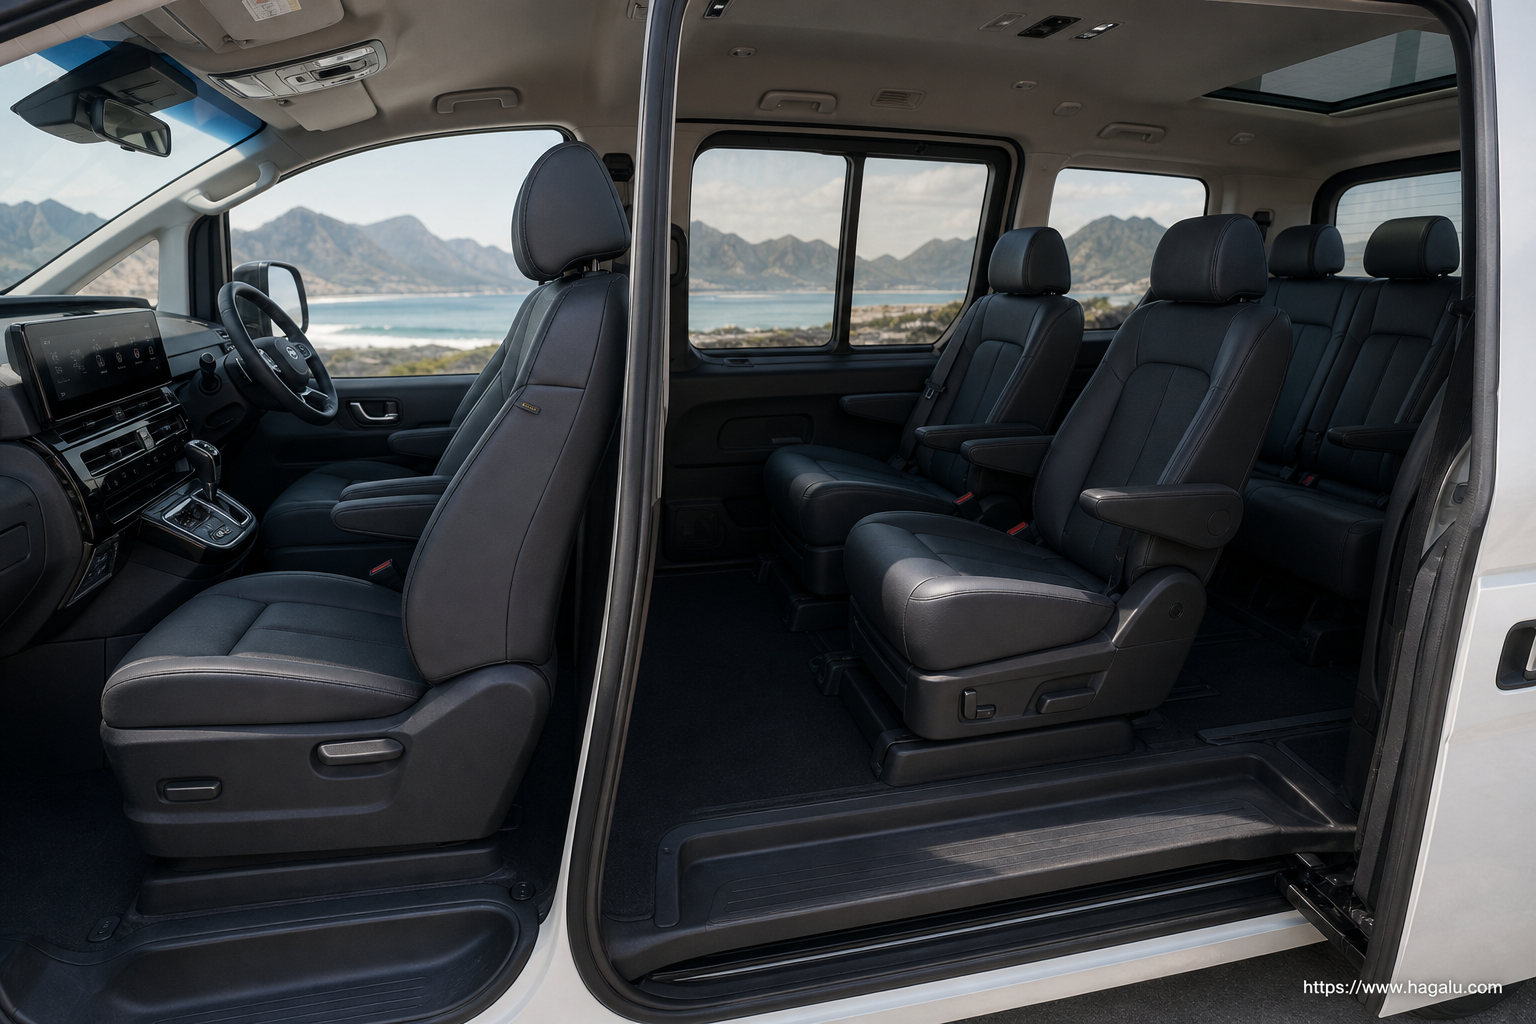
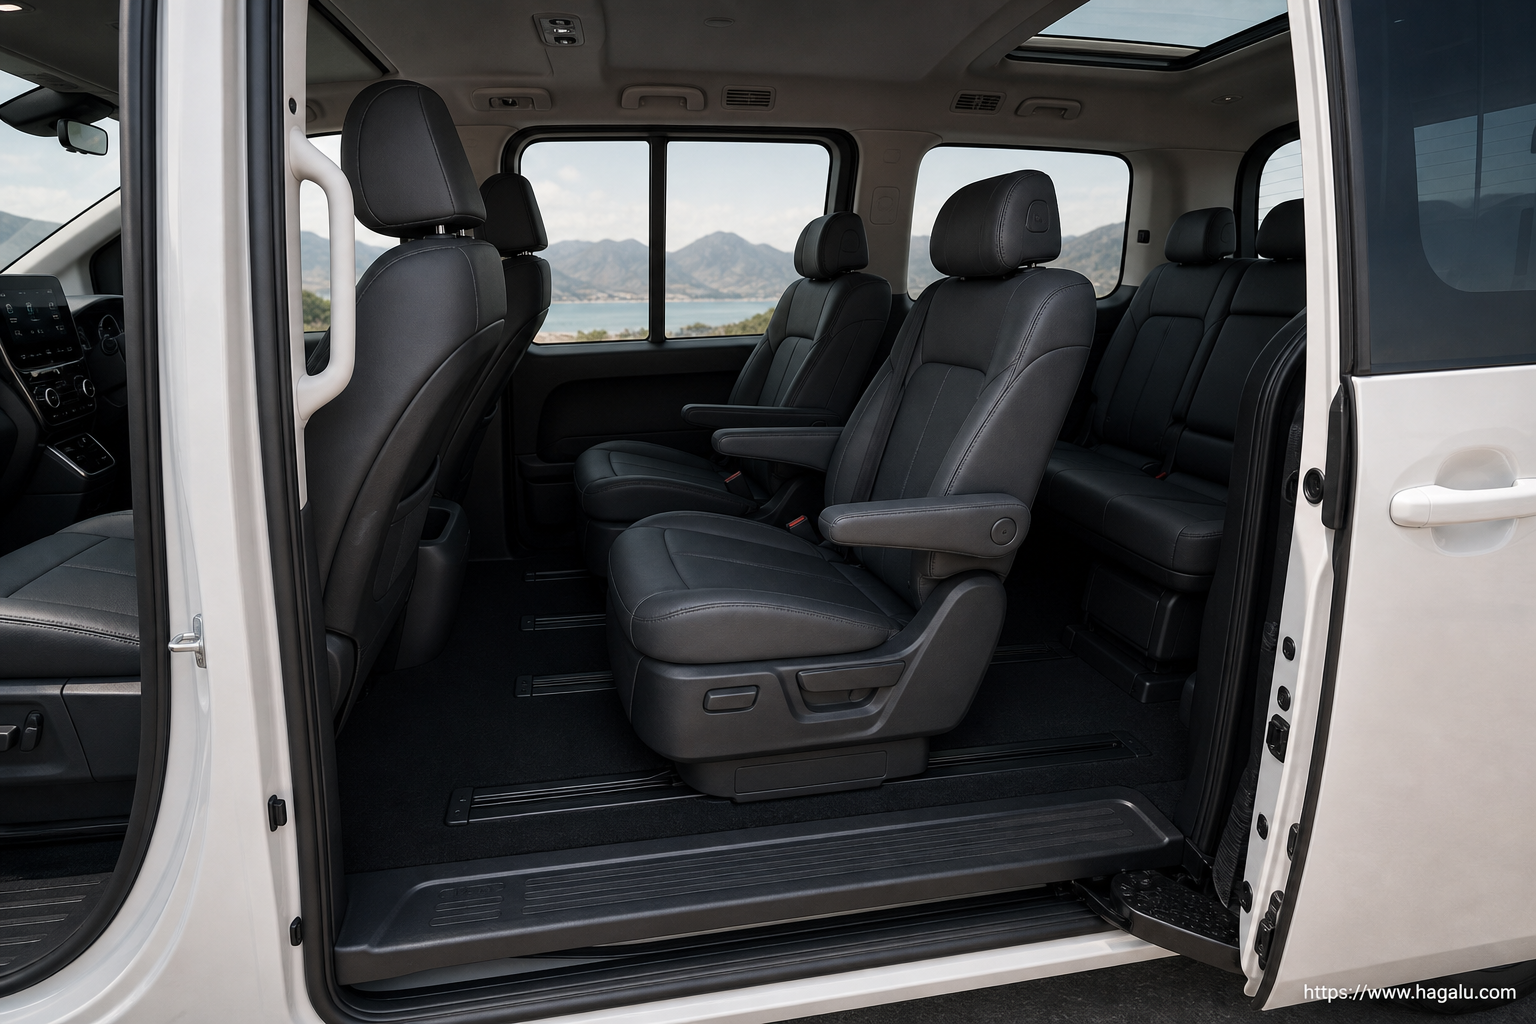
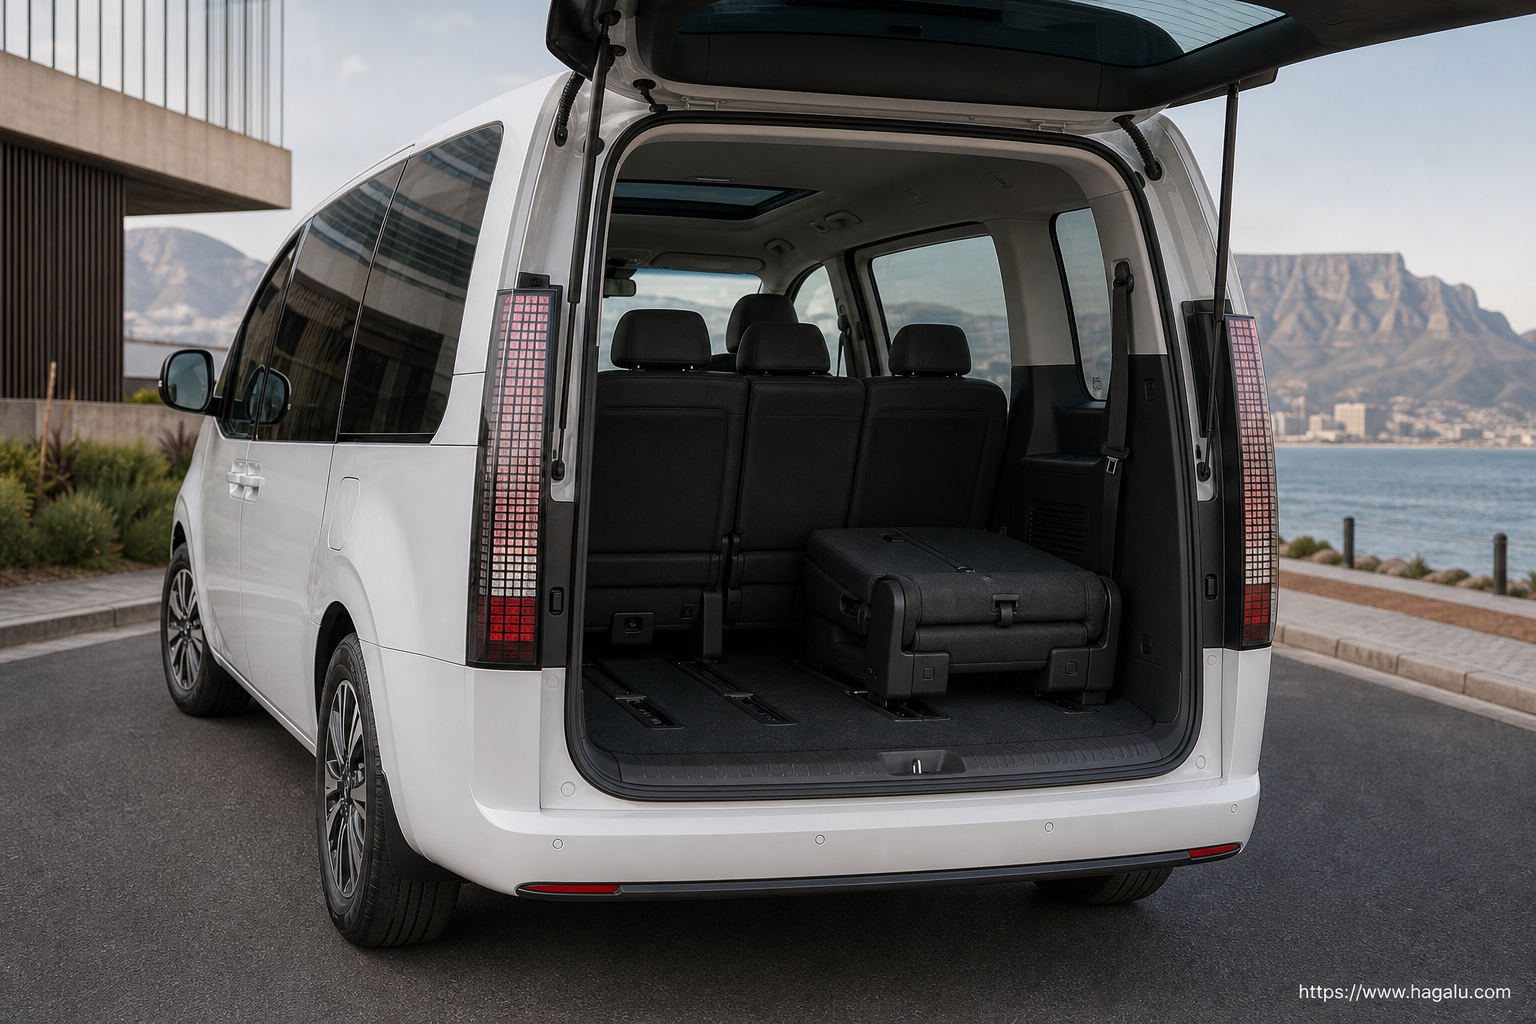
Rush and STARIA image comparison
Open an image for its full canonical file or visit the model page for the complete vehicle record.
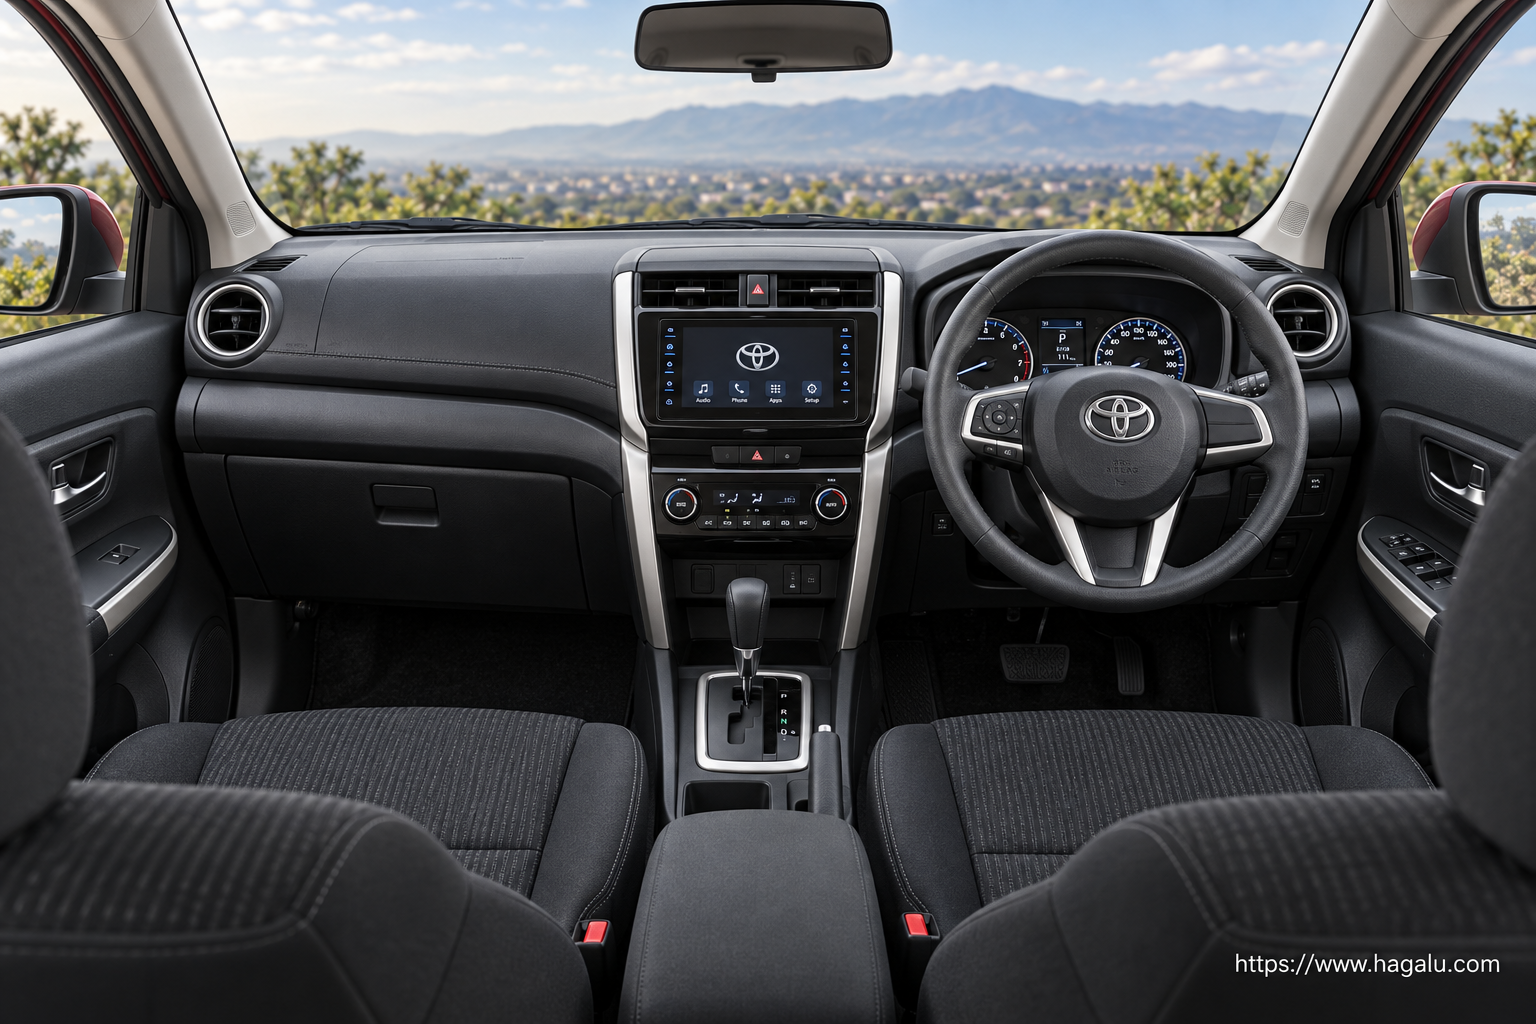
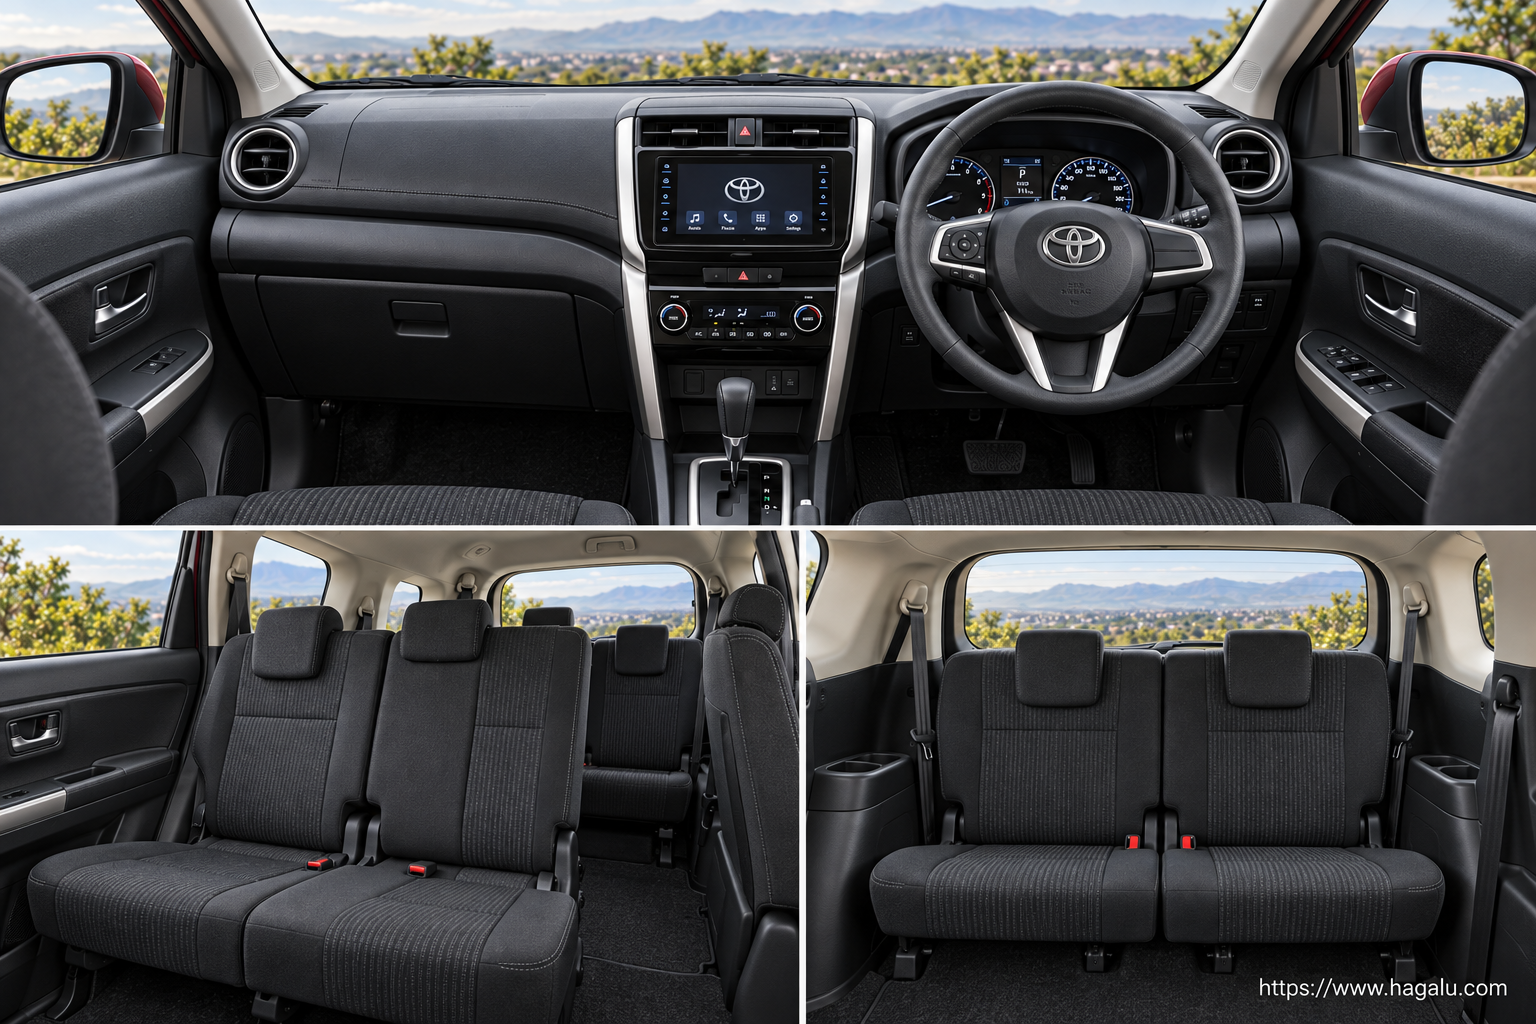
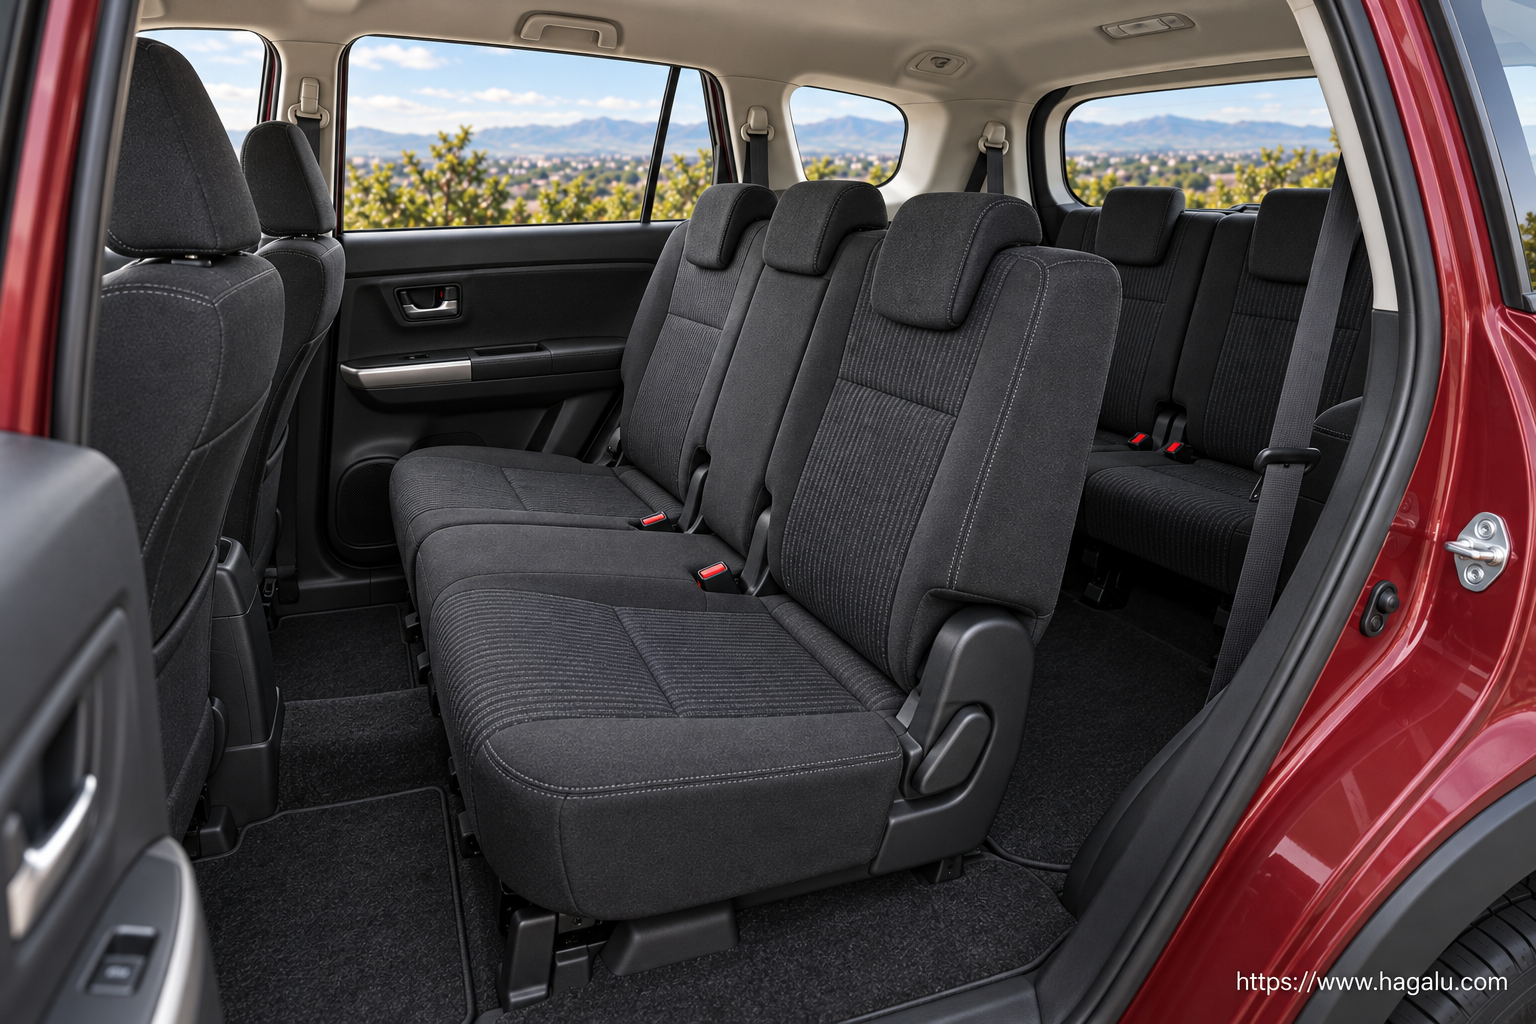
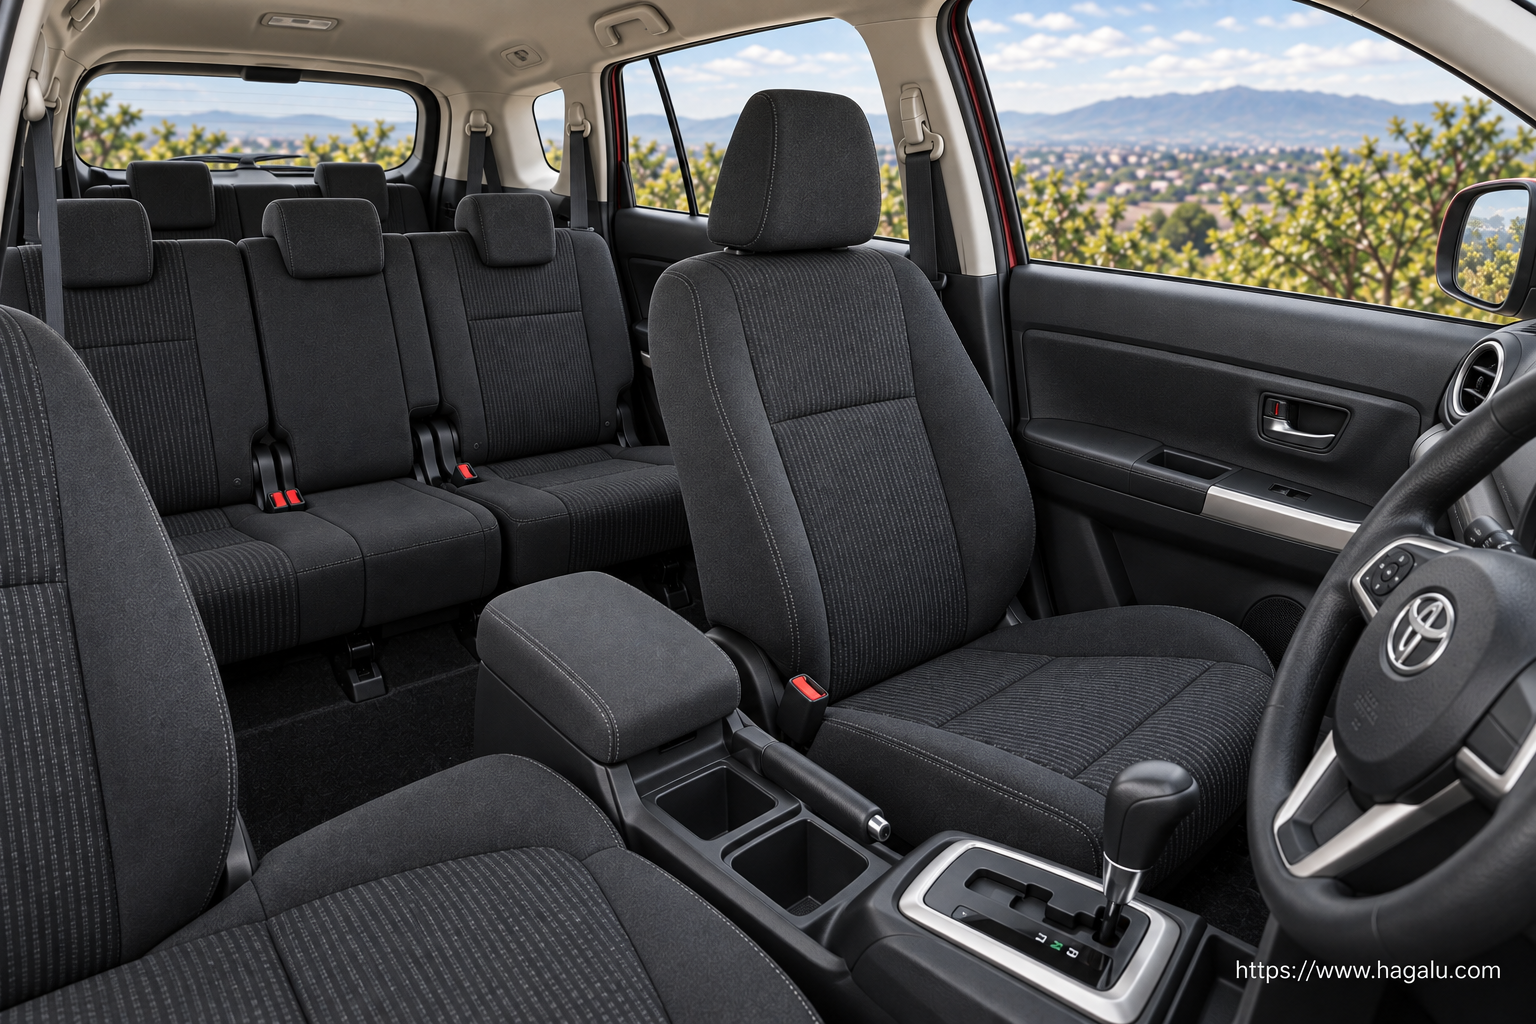
Toyota Rush
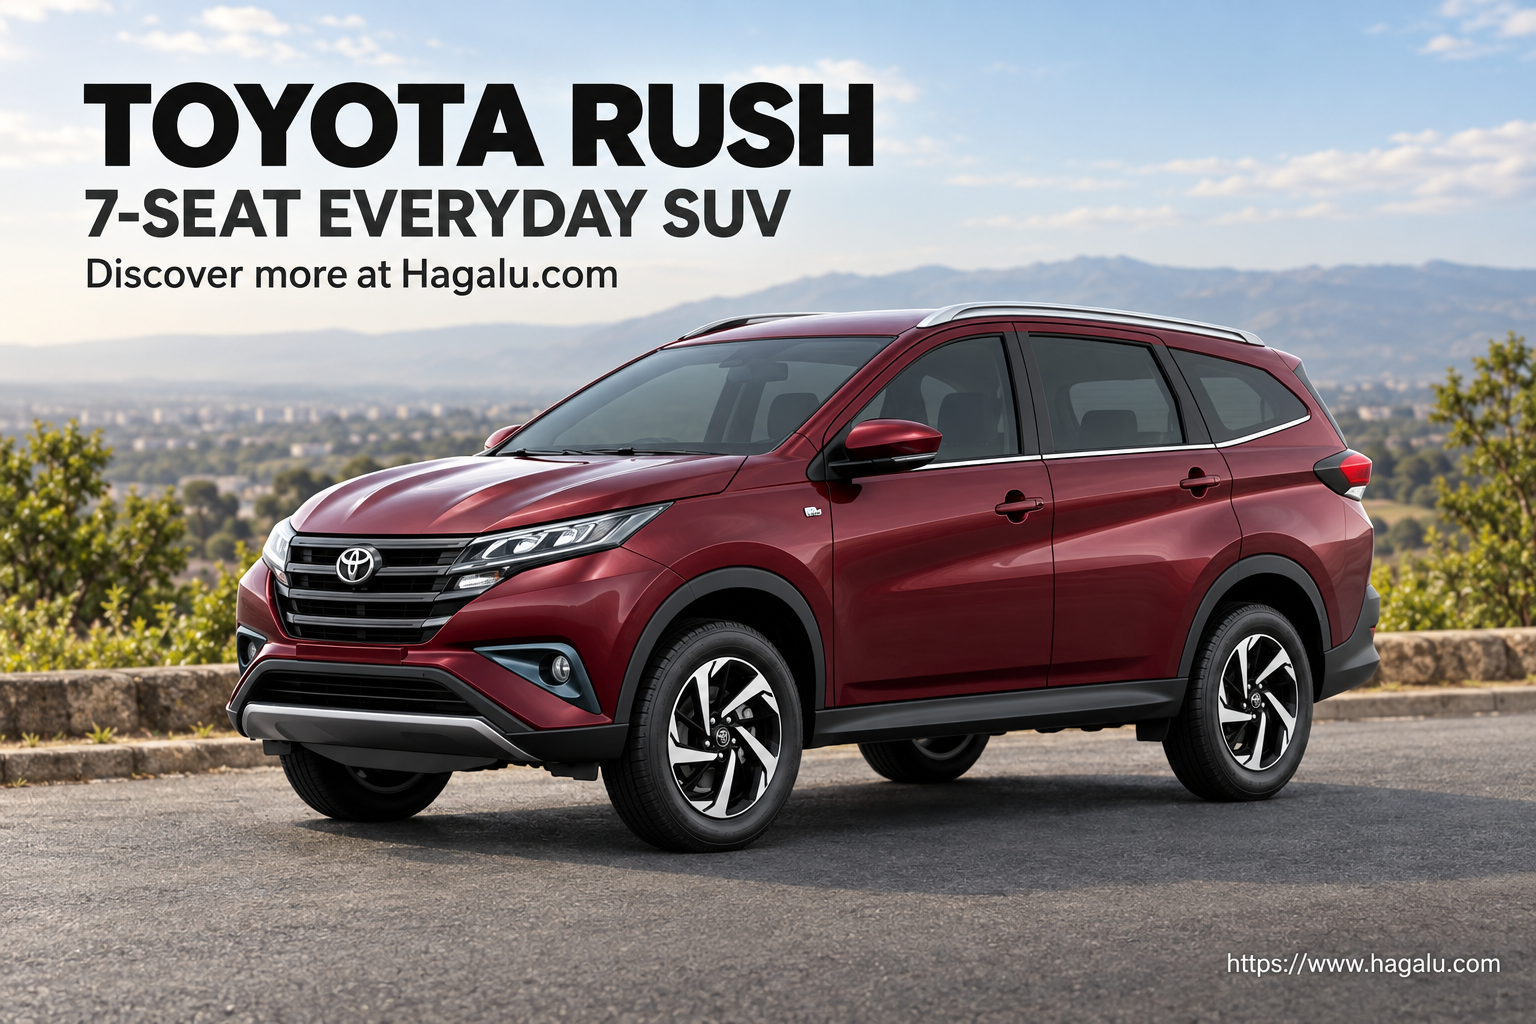
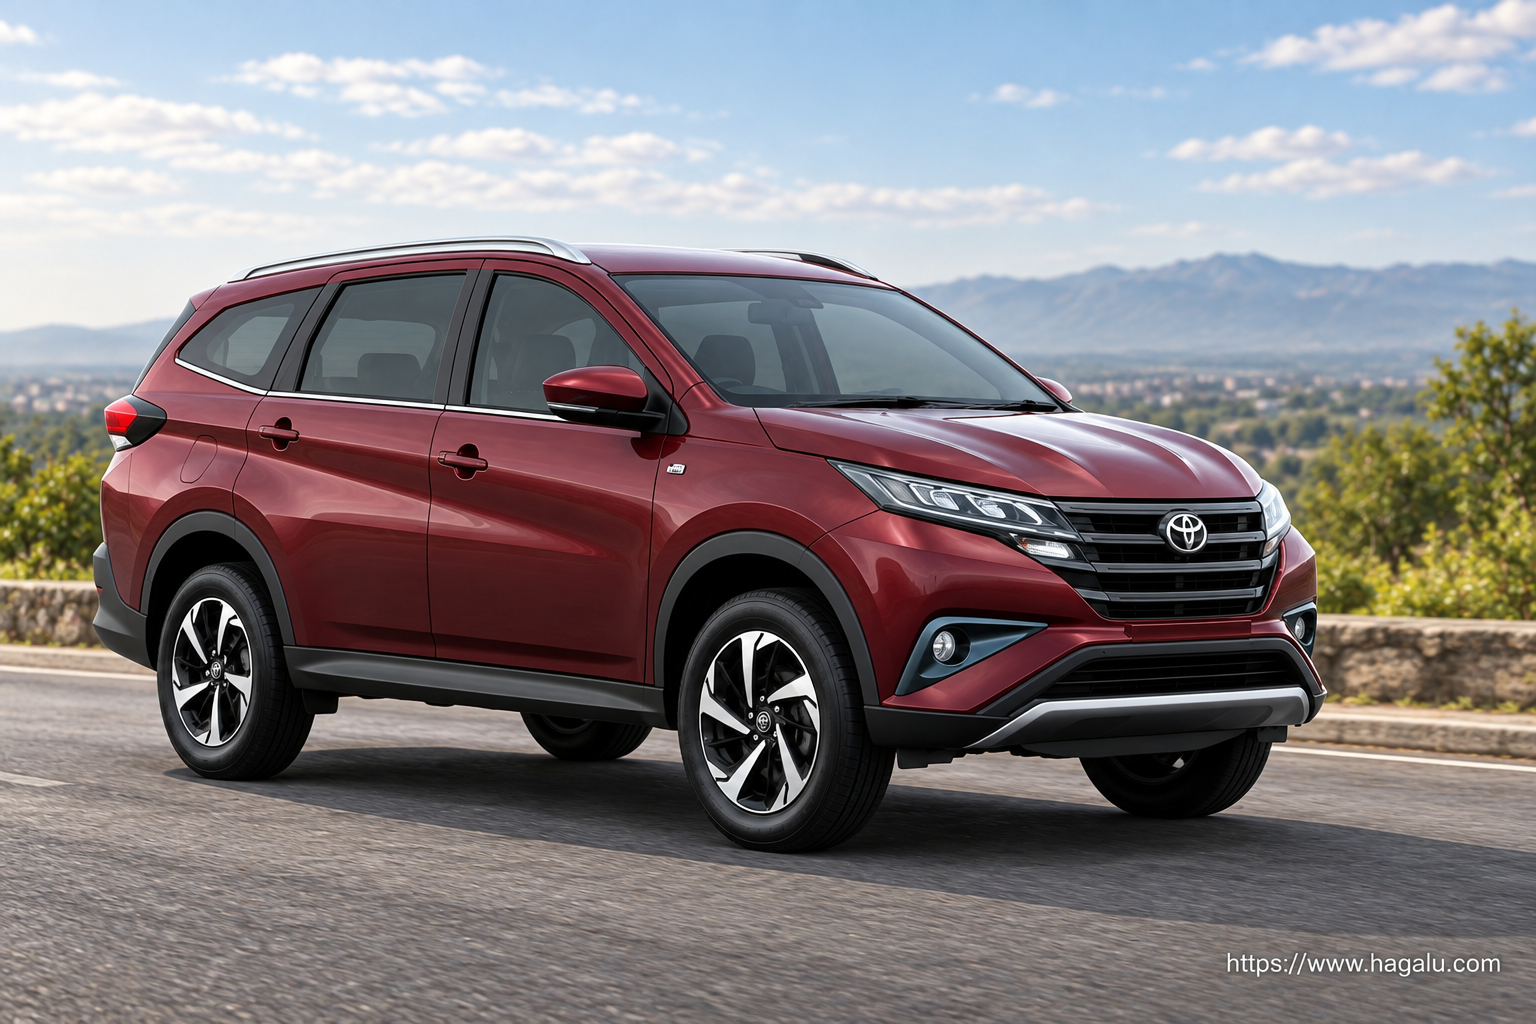
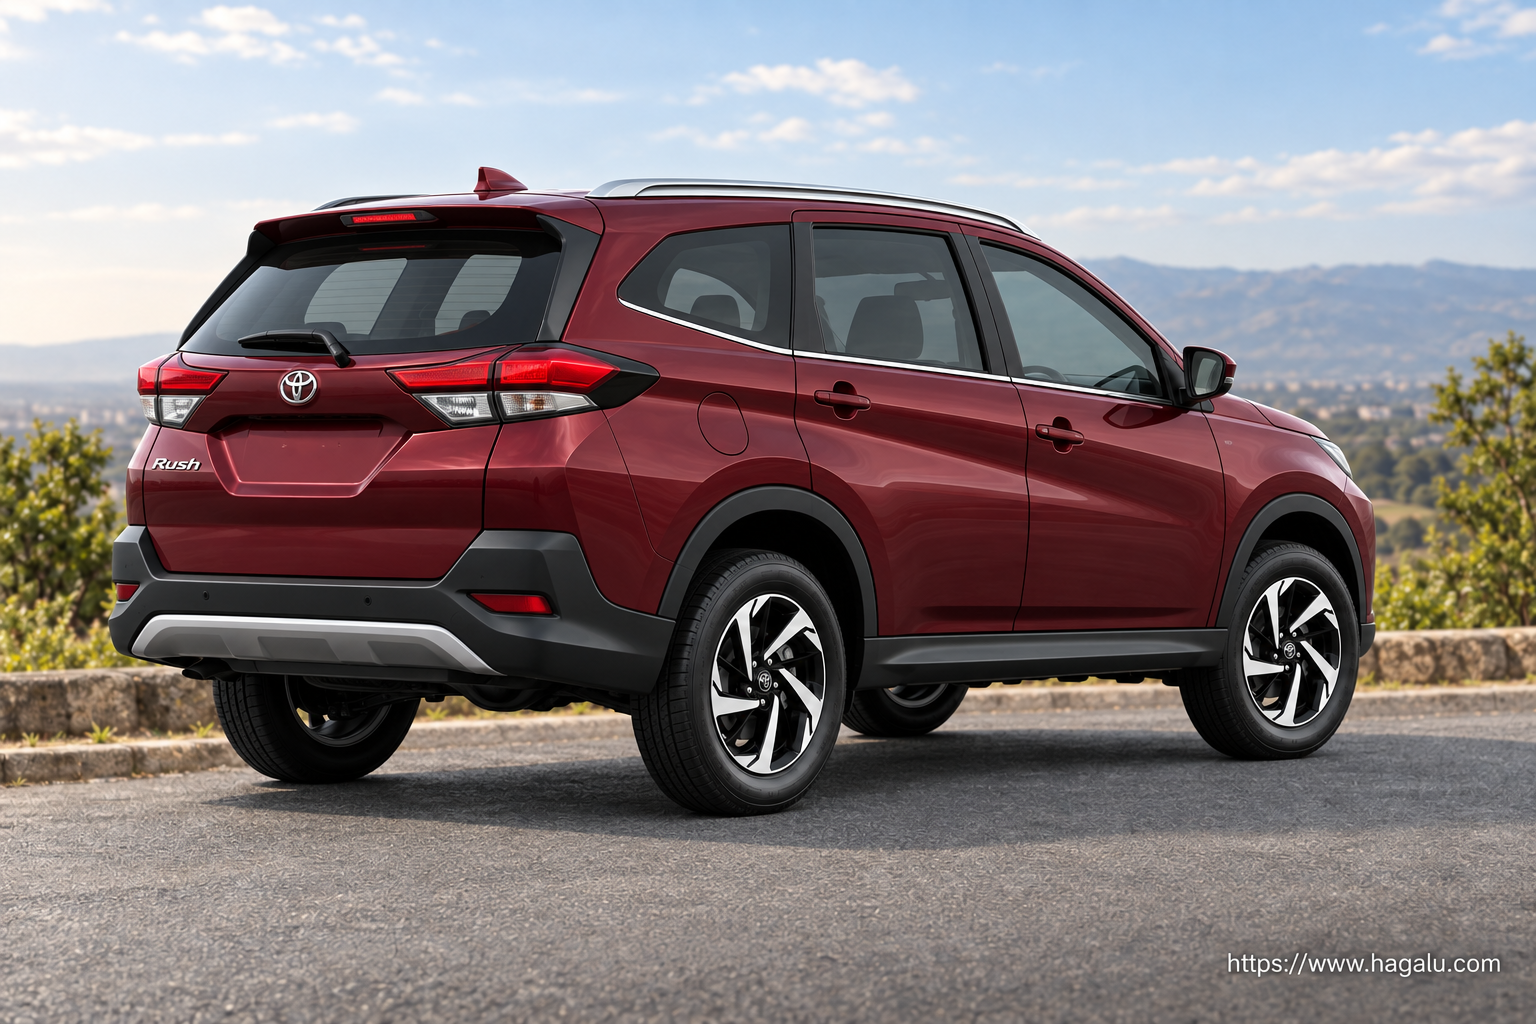
View 8 more Rush images
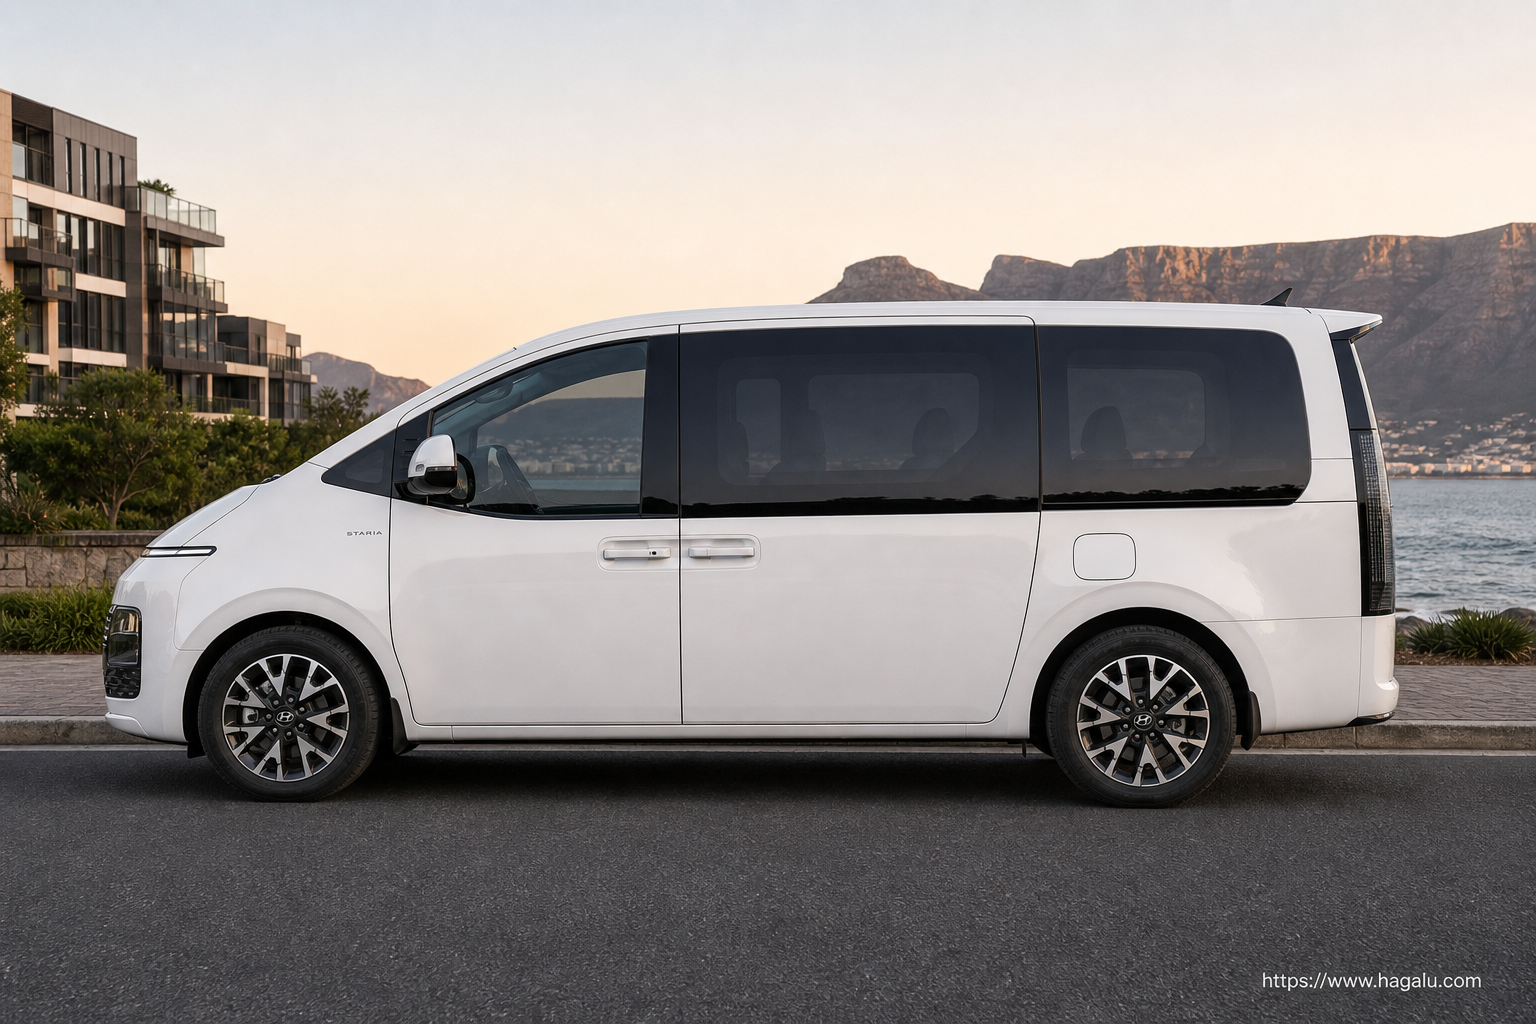
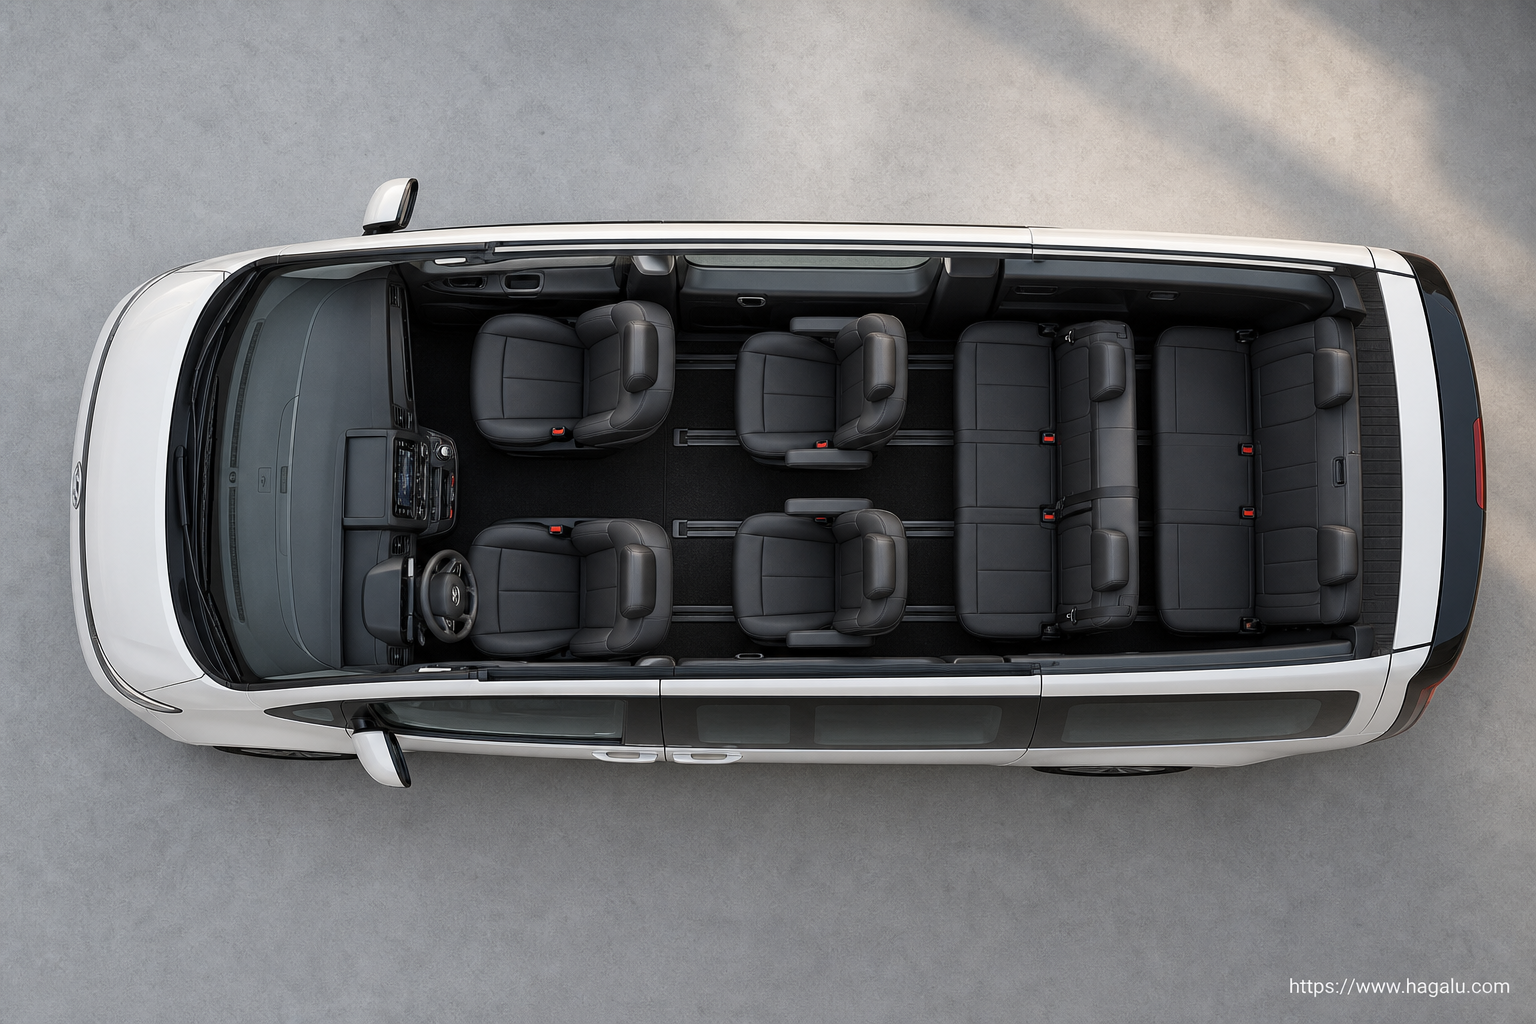
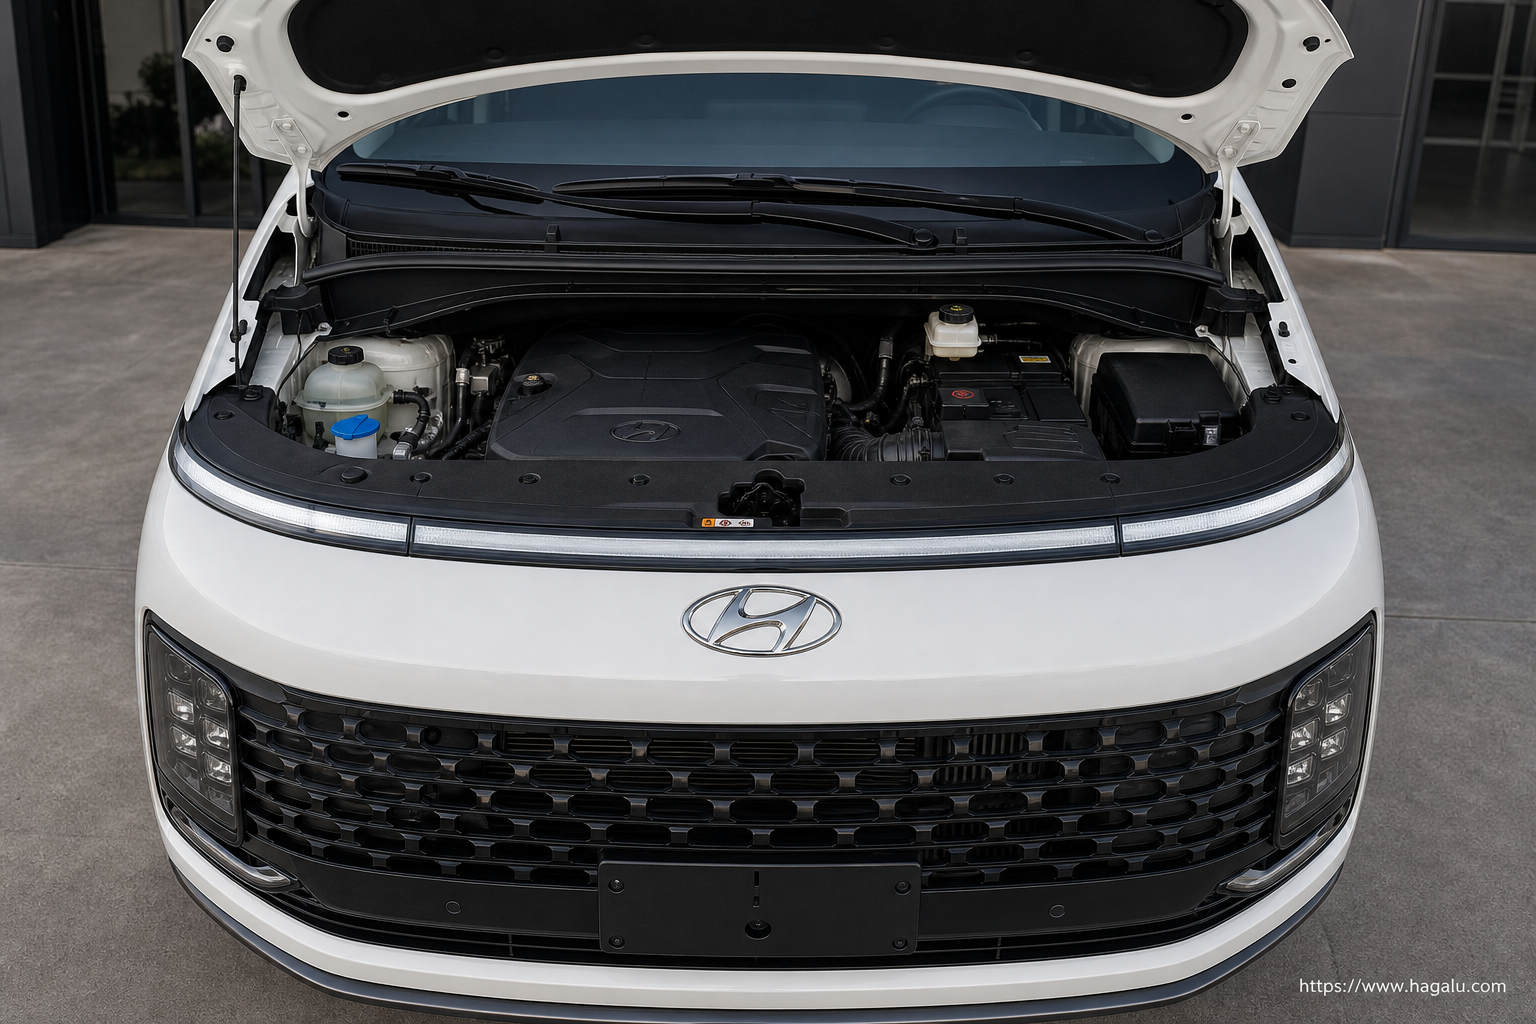
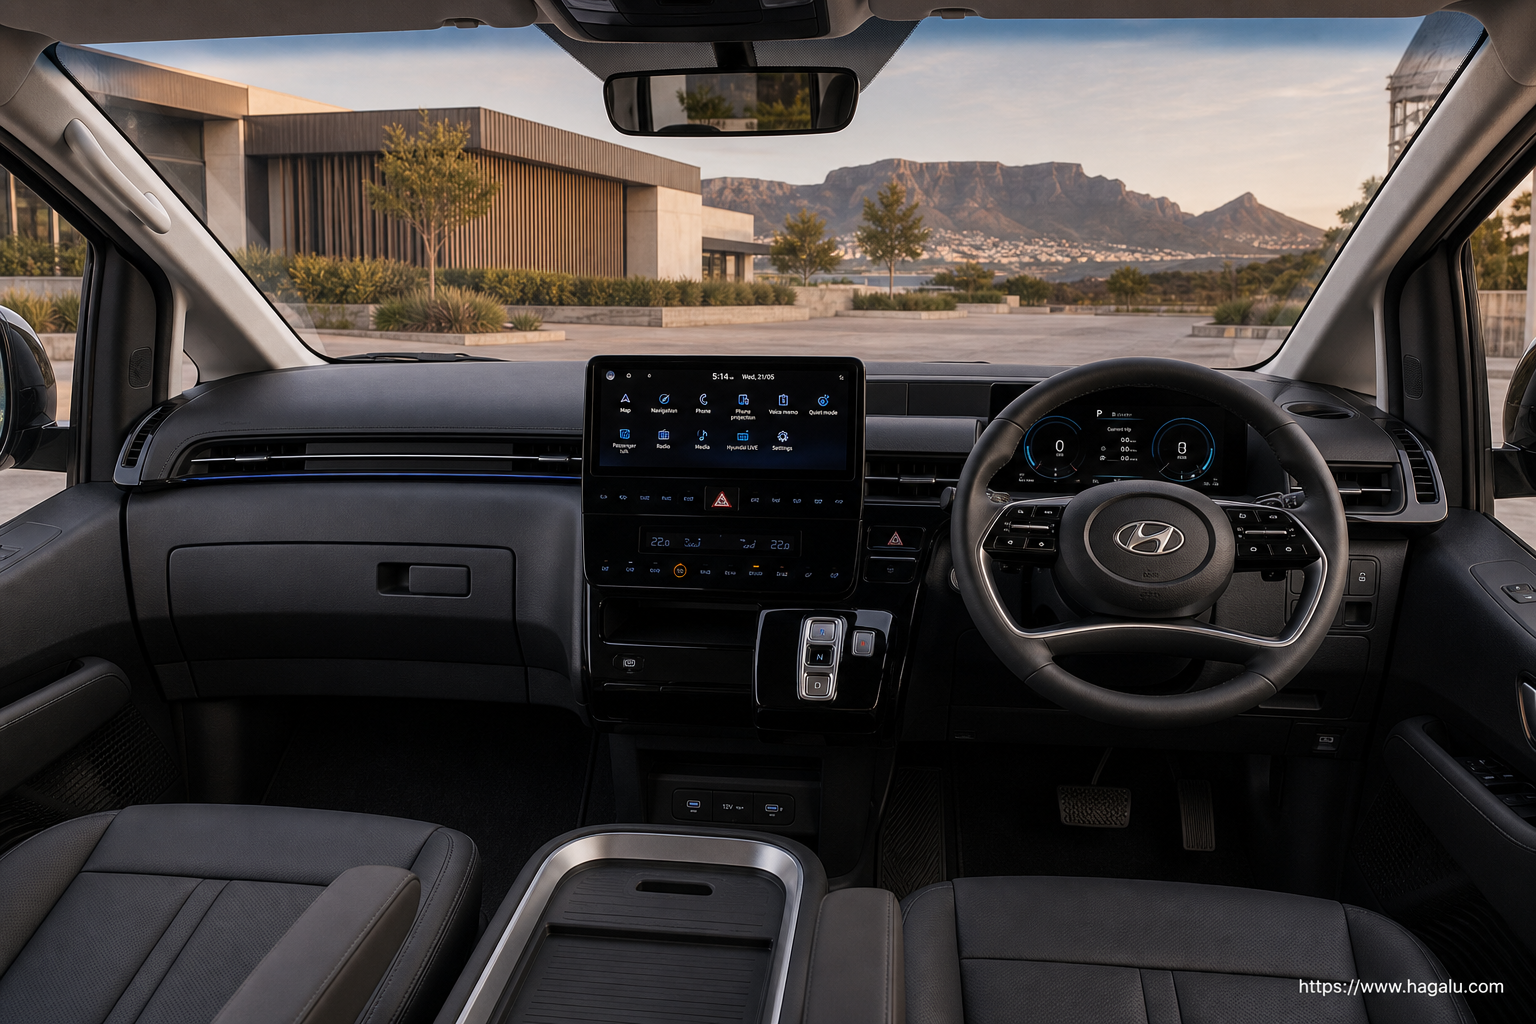
Hyundai STARIA
View 8 more STARIA images
Specification Evidence Index
A transparent comparison of published catalogue fields. This is not a road-test score, owner rating or editorial review rating, and it appears only when every vehicle clears the same comparable-data threshold.
Evidence-index readout
STARIA leads by 22 points
STARIA holds a noticeable catalogue-index lead over Rush.
Evidence leader
73
/100
Lead
22
points
Data
63%
source coverage
73
#1
Evidence leader
STARIA
Performance
67
Efficiency
46
Safety
94
Practicality
79
Leads by 22 points
51
#2
Rush
Performance
35
Efficiency
60
Safety
54
Practicality
60
Performance 24%
Safety 22%
Practicality 22%
Efficiency 17%
Ownership 15%
Category leaders
What moves the verdict
Performance
STARIA +32
Efficiency
Rush +14
Safety
STARIA +40
Practicality
STARIA +19
Moderate difference in the source-backed catalogue index.
Why this score View full breakdown
Evidence-index leader
STARIA
Performance
67/100
Efficiency
46/100
Safety
94/100
Practicality
79/100
Rush
Performance
35/100
Efficiency
60/100
Safety
54/100
Practicality
60/100
What the evidence means
In Hagalu's specification evidence index, STARIA leads. However, Rush may suit buyers prioritising different confirmed fields. Ultimately, the right choice depends on your driving priorities in Kenya.
Related comparisons
Continue with closely related Kenya models and comparable body styles.
Rush vs STARIA questions
There is no universal winner. Use the comparison table to match the models and available derivatives in Kenya on price, safety equipment, space, powertrain and ownership cover. The category indicators summarise published catalogue data; they are not a road test or customer rating.
Compare the published consumption or mileage rows for the exact derivatives using the same unit and test basis. A catalogue figure is useful for like-for-like comparison, but traffic, speed, load, weather and driving style can change actual fuel use.
Compare only equipment explicitly listed for each derivative, including airbags, stability control and driver-assistance systems. Confirm the exact trim with the manufacturer, and treat any independent crash-test result separately because equipment and ratings can differ by market.
A reliable five-year total cannot be calculated from catalogue data alone. Add the exact purchase and finance cost, fuel or electricity, insurance quotes, scheduled servicing, tyres and expected resale value. Check whether the selected derivative includes a service or maintenance plan.
Use the seating, boot or load-space, ISOFIX and safety rows as a first check. Then test the exact cars with your child seats, passengers and typical luggage, because published dimensions do not show every access or comfort difference.
Compare the published power, torque and 0–100 km/h rows when they are available for both exact derivatives. Vehicle weight, gearing and power delivery also matter, so catalogue outputs alone do not establish real-world overtaking or response.